Copy Trading for Brokers: The Network-Effect Math Behind Client Acquisition

Copy trading for brokers is usually evaluated as a product line that earns fee revenue. The larger effect sits on the cost side of the funnel. Once masters, investors and IB partners each have a financial reason to recruit the next client, part of your acquisition stops being something you buy. This article works through the arithmetic of that shift, and the conditions under which it does not happen.
A brokerage acquisition model usually has one shape: money in at the top, clients out at the bottom, and a cost per client that only moves in one direction. Every new client is purchased. Nothing in the funnel produces the next one.
Copy trading changes that shape, but not for the reason it is usually sold. The interesting part is not that investors pay performance fees. It is that a copy trading platform pays masters and IB partners from the fees each new investor generates, making recruitment their business as much as yours. When your own users are compensated for recruitment, a measurable share of your monthly client intake stops appearing on the marketing invoice.
A note on terminology before the arithmetic. Copy trading and social trading are used interchangeably across the industry, and retail-facing marketing tends to prefer the second. The two words emphasize different layers of the same mechanism. Social trading names the community layer, where performance is public and followers discuss it; copy trading names the execution layer that replicates a master's deals into investor accounts . Everything below applies to both, because the acquisition effect comes from the community layer and the revenue comes from the execution layer.
That share is quantifiable. Below is how to calculate it, where it comes from, and the four ways brokers stop the loop before it starts.
Key Takeaways
- What actually changes. Masters and IB partners do the recruiting, paid out of the fees their investors generate, which keeps that cost off your marketing budget.
- The one number to establish. Organic share, written k, is the fraction of each month's new clients that the loop delivers without a third-party acquisition bill.
- What k is worth. Total intake is your paid intake × 1 / (1 − k), and blended cost per client is your paid CAC × (1 − k). Nothing else in your funnel has to change for either to move.
- On real numbers. 300 paid clients at $600 alongside 226 organic ones puts k at 43%, blended CAC at $342, and roughly $136,000 a month on an invoice nobody ever issues.
- Where k comes from. Four independent loops generate it: public performance data, master self-promotion, partner fee sharing, and investors who graduate into masters. A loop nobody configured contributes zero.
- The precondition. Loops 2 and 3 generate most of k. Neither survives a payout that masters and partners have to chase.
- The catch. k is zero on launch day and stays there for about a quarter, until track records exist. Supply is the side you can seed, by converting accounts that already have trading history into master accounts.
Why Single-Sided Acquisition Keeps Getting More Expensive
A conventional retail brokerage funnel has no internal reproduction. A trader signs up, deposits, trades, and eventually churns. Their presence on your platform generates no new signups. Every replacement has to be bought again, in an auction against every other broker bidding on the same keywords in the same jurisdictions.
Two structural consequences follow. First, competitors' budgets set your cost per acquired client . Second, your marketing budget caps your growth rate: doubling your intake takes double the spend, permanently.
The usual answer is retention. Keep clients longer and the acquisition cost spreads over a longer lifetime. That helps the denominator, but it does not change the mechanism. A retained client still produces zero new clients.
The distinction that matters. Retention improves the return on each purchased client. A network effect reduces how many clients you have to purchase. Copy trading is one of the few additions to a brokerage that lowers how many you have to buy at all.
What the Network Effect Actually Is on a Social Trading Platform
The phrase gets used loosely, so it is worth being precise about the mechanism. A network effect exists when adding a participant increases the platform's value to the participants already there. The critical second condition is that those participants are motivated to bring more.
On a social trading platform the two sides are masters and investors, and each side is more valuable when the other grows:
- More masters make the platform more valuable to investors. A leaderboard with eight strategies is a shortlist. A leaderboard with 120 strategies across different risk profiles, instruments and track-record lengths is a market. Investors can filter by risk profile, compare track records and spread their money across several masters.
- More investors make the platform more valuable to masters. A master's income is a function of assets under management and investor profit. Every additional follower raises the ceiling on their performance, management, subscription and volume fees without their trading a single extra lot.
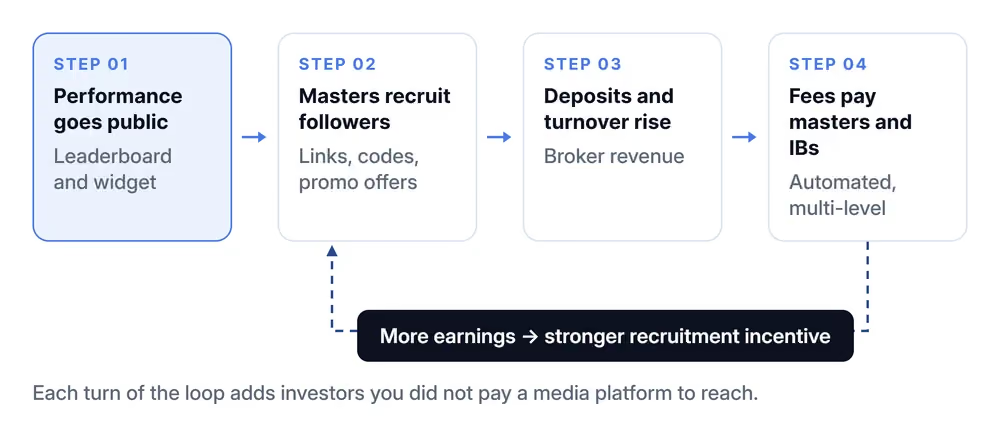
That second point is the engine. A master with 40 followers has a direct, quantified financial interest in acquiring the 41st. They market to their own audience for you, on channels you never had to buy.
The Core Math: Organic Share, Amplification and Blended CAC
The whole effect can be expressed with one variable. Call it k, the share of your monthly new-client intake that the loop delivers.
Count only clients you did not pay a third party to reach: investors brought in by masters, by IB partners, by existing investors, or arriving through leaderboard and widget traffic on your own pages.
Two consequences follow directly, and both are plain arithmetic.
Consequence 1: The Amplification Factor
If a fraction k of your intake is generated internally, then each purchased client is accompanied by additional clients you did not buy. Over a full acquisition cycle the total intake is your paid intake multiplied by:
This is a bounded geometric series, not exponential growth. As long as k stays below 1, the loop amplifies your paid spend by a fixed multiple and never runs away. Reaching k = 1 would mean the client base sustains itself with no paid acquisition at all, and no retail brokerage should plan around that.
Consequence 2: Blended Cost per Client
Your marketing spend is unchanged, but it is now divided across more clients. The blended cost per acquired client falls in exact proportion to k:
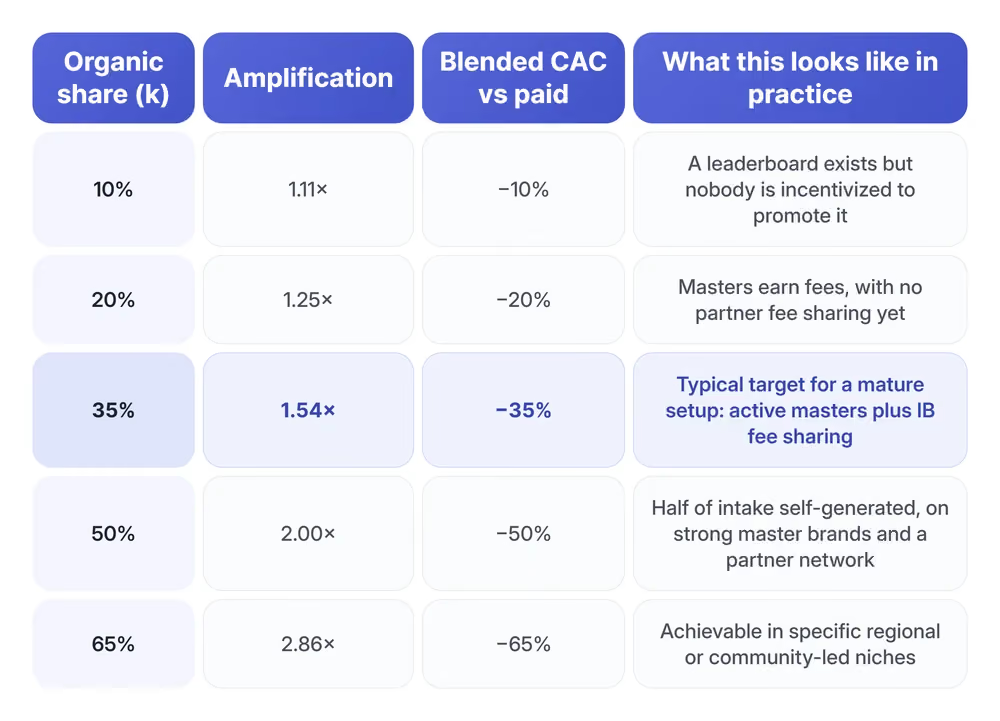
A k of 0.35 cuts the average cost of a client by 35% before you touch your bidding, creative or landing pages.
A Worked Example
A mid-sized broker running copy trading alongside its standard offering. Its $600 paid CAC sits below the $1,000 the industry reports for a funded retail client . Read the saving below as the conservative case. Monthly numbers:
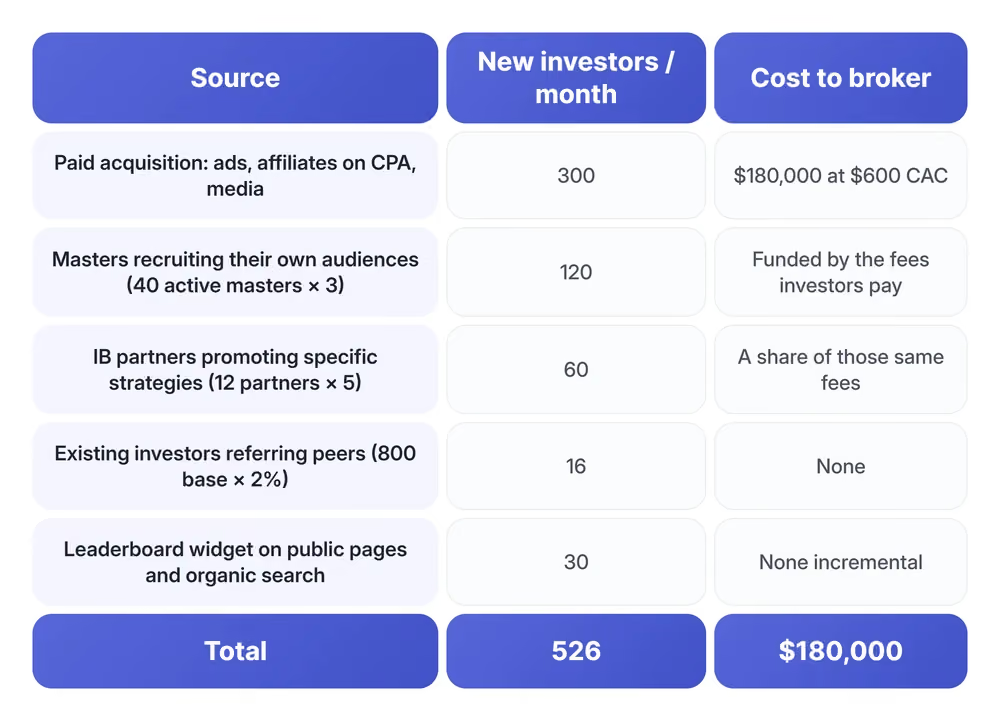
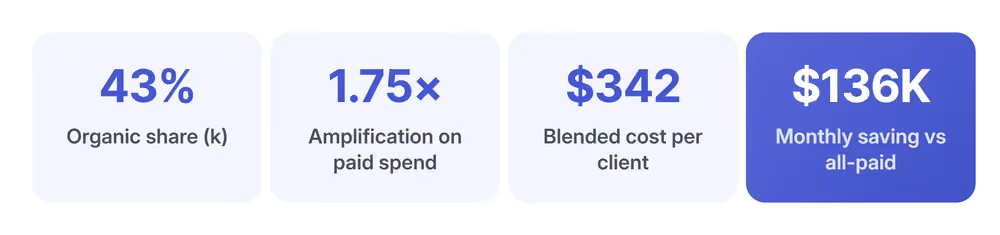
The final figure is the one to take to a board. Buying all 526 clients at $600 would cost $315,600; the broker spends $180,000. The roughly $136,000 a month between those two numbers is an invoice that was never issued.
Where this model is fragile. The numbers above rest on two behavioral assumptions: how many masters stay active, and how many investors each one actually brings. Both vary enormously by market, and on day one both are zero. Substitute your own figures before you rely on any of it, and you can run them through the same arithmetic with B2COPY ROI calculator .
The Four Loops That Generate k
Organic share is not a single number you improve by wanting it. It is the sum of four independent mechanisms, each with its own driver and each requiring specific functionality from the copy trading platform to work. If a mechanism is not configured, its contribution to k is zero.
Loop 1: Public Performance Data
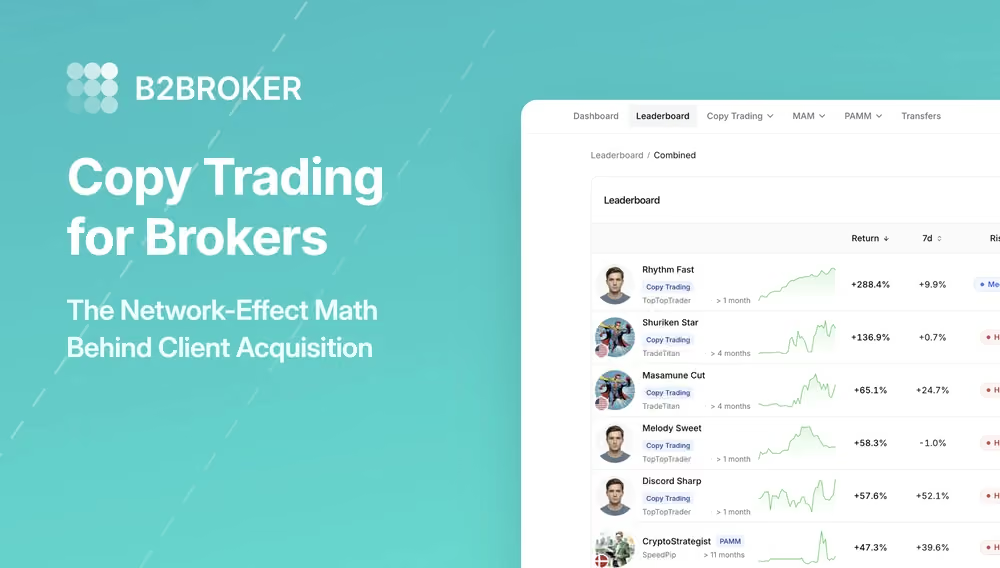
This is the social trading layer doing acquisition work. A leaderboard ranks masters by total return, 7-day return, follower count and assets under management, with filters and risk indicators. Embedded on public pages as an iframe widget, it lets visitors inspect a strategy's statistics and click through to subscribe. The strongest proof in your business stops being a logged-in screen and becomes a landing page.
Driver. Verified track record as marketing collateral.
Loop 2: Master Self-Promotion
Masters set their own fee plans across performance, management, trade, subscription, joining and profit fees. Income scales with followers, so recruitment becomes their problem to solve. Their channel is a direct subscription link to the strategy, which a subscription code can narrow to invited holders or a promo offer can sweeten with a discounted fee plan.
Driver. Master income is a function of AUM.
Loop 3: Partner Fee Sharing
IB partners can be rewarded from the fees investors pay, in addition to standard volume-based rebates from your own wallet. Multi-level structures split every fee type automatically across the referral tree. A partner attached to an investor earns from the fee split as well as from the volume rebates. That second stream is what decides which product they put in front of their audience.
Driver. A second reward stream the investor funds.
Loop 4: Investor-to-Master Graduation
Some investors follow strategies long enough to start running one of their own. Each graduation converts a cost center into a recruitment node, turning the client you paid for into a source of clients you do not. This is the slowest of the four loops and the one most brokers never instrument, but it compounds the supply side of the market.
Driver. Supply side grows from the demand side.
Loops 2 and 3 do most of the work, and neither runs unless fee calculation and distribution are automated. If a master's earnings depend on your finance team producing a spreadsheet each month, or if partner splits are reconciled manually, the incentive weakens in exactly the way that matters. Masters and partners who stop trusting the payout stop promoting.
Cold Start: The Loop Does Not Start Itself
Every number above depends on there being active masters with visible track records. On launch day you have neither, and that is the single most common reason brokers conclude copy trading "did not work". The loop was never given enough initial mass to turn.
The deadlock is symmetrical. Investors will not subscribe to a leaderboard with four strategies and no history. Masters will not promote a platform with no investors to earn from. Neither side moves first on its own.
The resolution is asymmetric. You cannot manufacture investors. You can manufacture supply almost immediately, because the accounts on your server have been trading for years already. Converting an existing account into a master account carries its history onto the leaderboard intact, which turns a two-year wait into a two-week one.
Set one expectation regardless. Because a track record is made of elapsed time, the first turn of the loop takes about a quarter. A strategy with 21 days of history is not something an investor with $10,000 will act on, whatever its return.

Four Ways Brokers Break the Math
Each of the four below switches off a loop the platform was ready to run.
Failure 1: Treating It as a Product Launch
Copy trading is shipped, announced, and then left alone. Nobody owns master recruitment. Six months later there are 11 registered masters, three of them active, and the leaderboard converts nothing. The functionality was never the constraint.
Failure 2: Keeping the Leaderboard Behind Login
Your strongest asset is verified performance data that only registered clients can see. Loop 1 is switched off, and the platform can only reinforce acquisition you already paid for.
Failure 3: Manual Fee and Partner Payouts
Fees are calculated in spreadsheets or paid on request. Masters and partners stop trusting the payout, and loops 2 and 3 stop with them. Those are the two that generate most of k.
Failure 4: Promoting Before Configuring Risk
Marketing drives traffic to a leaderboard where risk limits are absent or master-overridable. The first blowup arrives amplified across every follower, and the reputational cost exceeds everything the loop delivered. Supervisors add their own line to that bill. Where the investor does not approve each trade, ESMA treats the service as portfolio management , with the suitability duties that follow.
The Bottom Line
The revenue case for copy trading is real enough: six configurable fee types, higher turnover per client, longer lifetimes. It is also not the interesting part. What copy trading changes is the arithmetic of acquisition, moving the cost out of an external auction and onto the people already using your platform.
That effect is measurable with one number. Establish your organic share, and both the amplification factor and the blended cost per client follow directly. Four configuration decisions set that number:
- whether the leaderboard is public
- whether fee distribution is automated
- whether partners can earn from investor fees
- whether your best traders were ever invited to become masters
None of it happens by default. The copy trading platform supplies the mechanism; the loop has to be seeded, measured and guarded. But once it turns, it is the only part of a brokerage growth model that gets cheaper as it gets bigger.
The questions below come up in the first call with a broker weighing the model.
Frequently Asked Questions Copy Trading for Brokers
What is copy trading for brokers?
A copy trading platform replicates one trader's deals into the accounts of the investors who subscribe to them. That account type earns fees for the broker. It also turns masters and IB partners into recruiters whose income moves with the size of the book.
Is copy trading the same as social trading?
In practice, yes. One execution engine sits under both names. Retail marketing prefers social trading for the community it implies, while vendor documentation prefers copy trading for the mechanism.
What is organic share, and how do I measure it?
Take one month. Count every new client nobody billed you for: the ones masters and IB partners brought, the ones existing investors referred, and the ones who found a public leaderboard or an embedded widget. Divide that by all new clients for the month, and you have k.
How much does a network effect cut cost per client?
Blended cost per client falls in exact proportion to k. At a k of 0.35 the average client costs 35% less than your paid CAC, with no change to bidding, creative or landing pages. Amplification runs off the same number. Multiply your paid intake by 1 / (1 − k): at a k of 0.35 you get 1.54 clients for every one you buy.
Which mechanisms actually generate organic share?
Four: public performance data, master self-promotion, partner fee sharing, and investors who graduate into masters. Each has to be configured before it contributes anything.
Does the leaderboard have to be public?
No, but keeping it behind a login switches off the loop that turns performance data into a channel. A public leaderboard, or the same data embedded as a widget on your own pages, lets a visitor inspect a strategy's statistics before deciding to register.
Can IB partners earn from copy trading fees?
Yes. Partners can be rewarded from the fees investors pay, on top of the standard volume-based rebates that come out of your own wallet. Multi-level structures split every fee type automatically across the referral tree, every billing cycle.
How long does the loop take to start turning?
About a quarter. Twenty-one days of history is not a track record, whatever the return printed next to it.
How do you launch copy trading with no masters and no track records?
Supply is the side you can manufacture. Accounts on your server have already been trading for years. Convert one into a master account and its whole history moves onto the leaderboard with it.
Recommended articles
Subscribe to our newsletter