
Per-Master Analytics
Detailed Statistics Page for Every Account
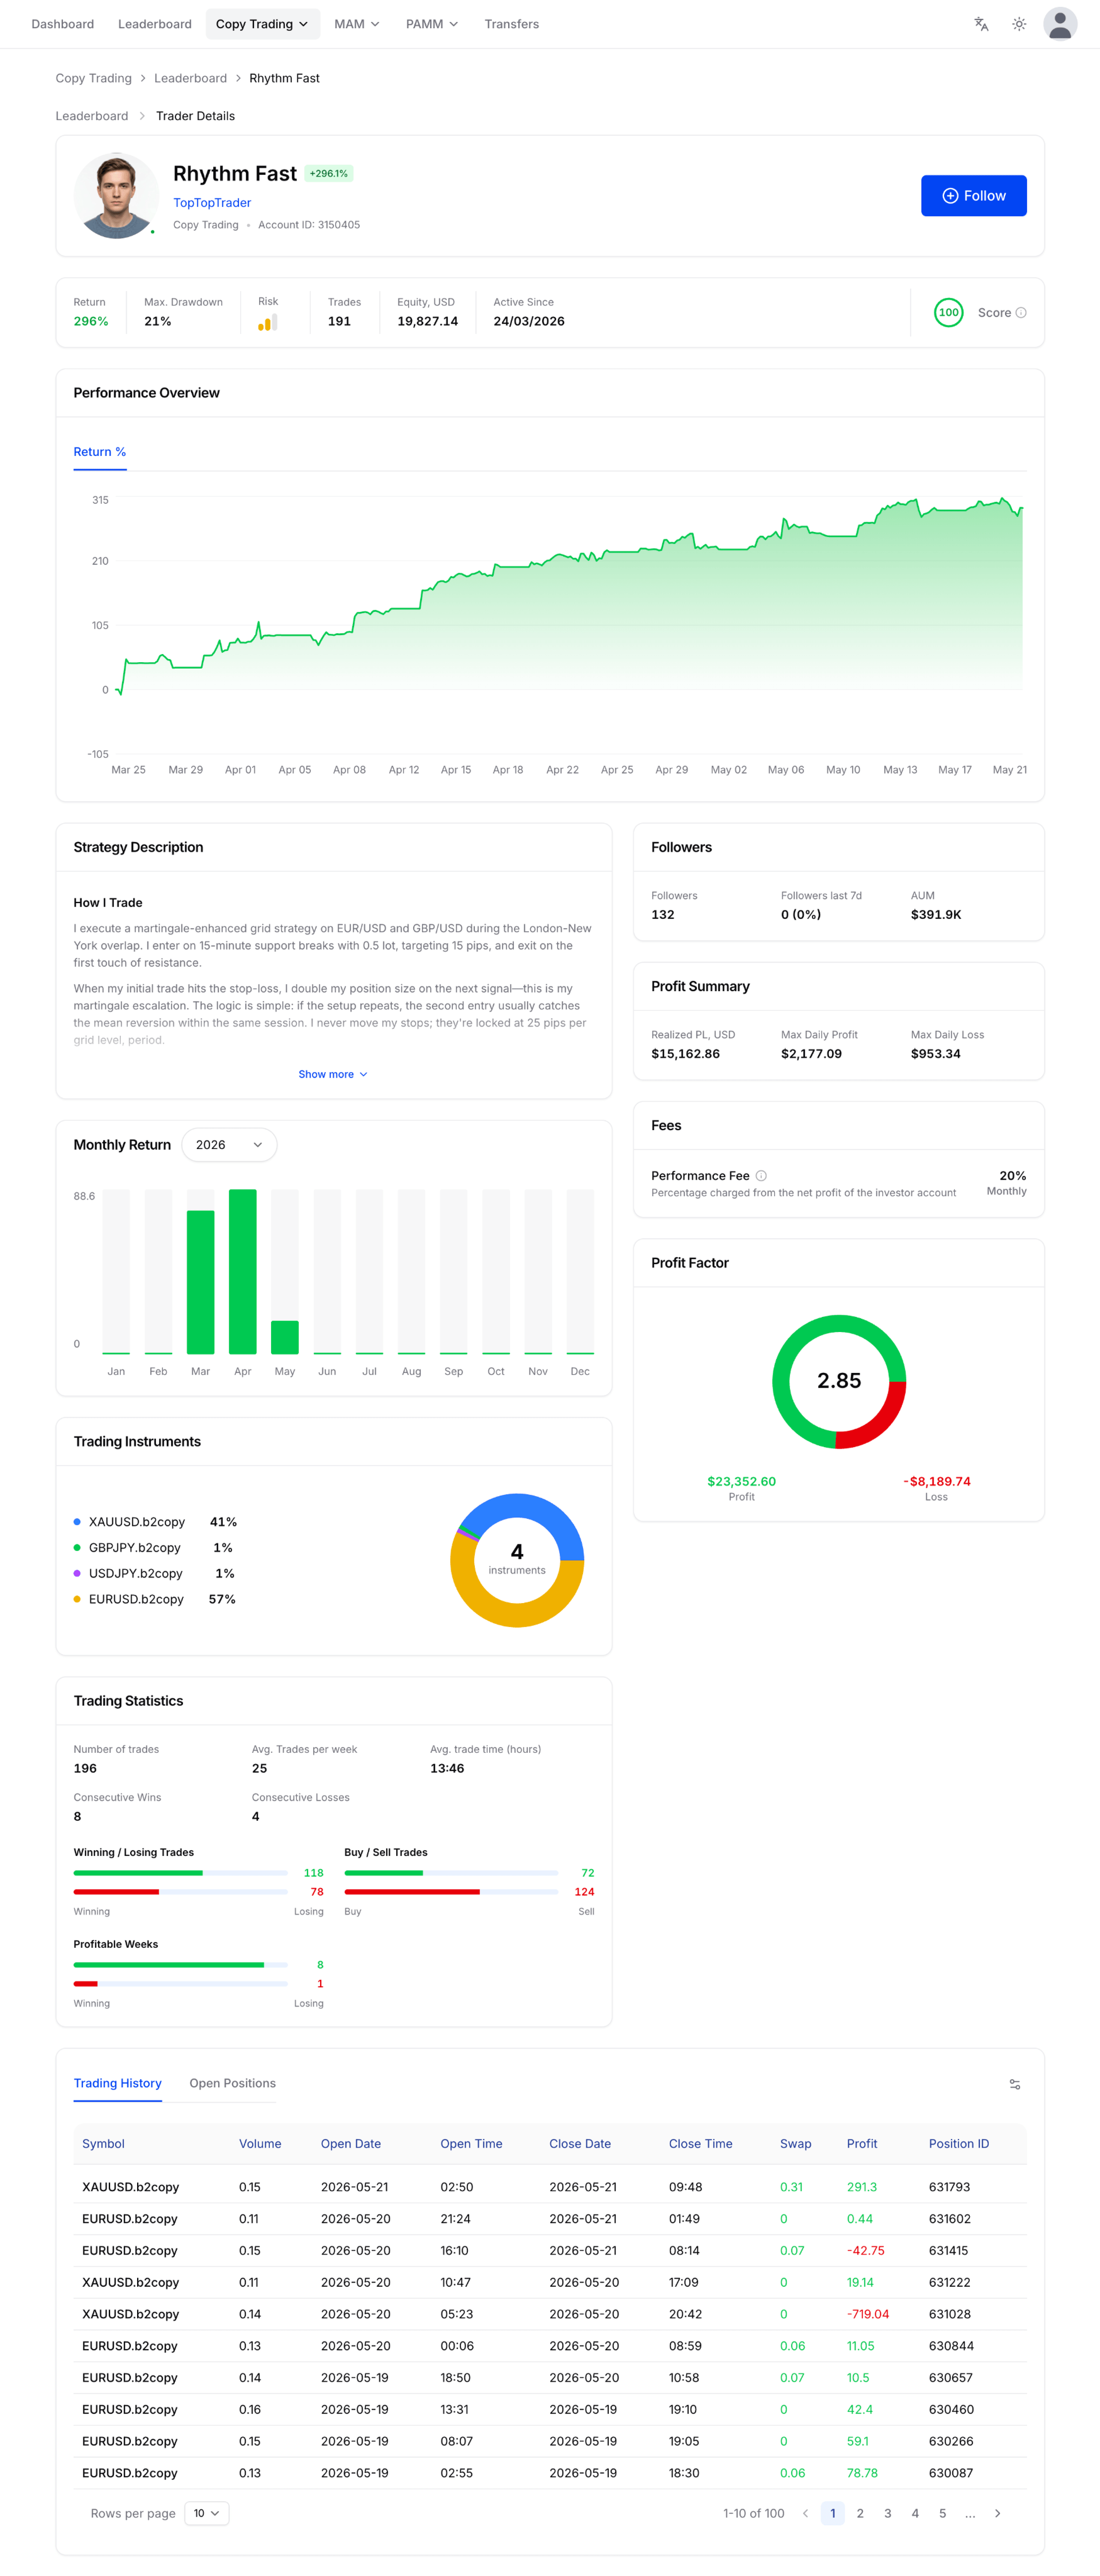
A block-by-block tour of the master statistics page: 12 sections, 25+ metrics. What each one shows and what it means for investors, masters and the broker.
Why this depth matters
One Statistics Page, Three Audiences
Transparent statistics are a competitive advantage for the broker. The more parameters an investor can see, the higher their confidence in their choice — and the fewer complaints land in support. The easier it is for a master to manage their public card, the more actively they attract followers. B2COPY turns the trader profile into a full-fledged marketing and retention tool inside your brokerage platform.
For the Master — A Personal Storefront
Avatar, name, return badge, free-form strategy description and a public scoreboard give every master a mini-brand inside your platform. The page is the master's primary tool for attracting followers and growing their performance-fee income.
For the Investor — An Informed-Decision Toolkit
25+ metrics, a full equity curve and the entire trade history mean an investor never has to ask “but what are they actually doing?”. Subscribe with informed consent — and stay subscribed through the first drawdown because nothing was hidden.
For the Broker — A Retention and Compliance Instrument
Transparent fees, an open strategy description and a visible audit trail cut “I wasn't warned” complaints. Top masters' cards plug straight into social posts, email campaigns and case studies — marketing gets content out of the box.
01 · Profile header
Master Identity and Headline Return in the First 200 Pixels
Everything an investor needs to decide “is this card worth more of my time?” sits above the fold — a four-element decision package the investor reads in half a second. The same block gives the master a personal storefront that follows them everywhere their card is shared.

+296.1%
Avatar, Name and Return Badge
A green return badge next to the name is the first impression. Large type, concrete number, no marketing fluff. Within half a second the investor knows they are looking at a successful trader — and the master gets a public scoreboard worth pulling up.
Strategy Title
A short label the master sets themselves (e.g. “TopTopTrader”). Functions like a mini-brand — investors recognise and follow specific strategy names, not anonymous account numbers. A way for the master to stand out among look-alike strategies.
Follow Button
Pinned to the top-right and accessible from every block on the page — an investor never has to scroll back up to subscribe. Fewer steps between “I like this” and “I'm following” means a higher follow rate for the broker.
Account ID
Displayed openly as part of the B2COPY transparency culture. Your clients see that the card is backed by a real account with real trades, not a marketing deck — and audits can always reference a specific Account ID.
02 · Core KPIs
Six Critical Metrics and an Aggregate Score in One Row
A compact KPI bar that answers 80% of an investor's questions without any scrolling. The same bar gives masters a clear, public scoreboard — they see their leaderboard position and immediately know which metrics to pull up to grow.

296%
Return
Total return since the account went live. The most direct outcome metric — the number every investor compares first.
21%
Max Drawdown
The deepest peak-to-trough equity loss across the account history. The primary risk indicator — the investor sees up front what losses they need to be prepared for in a worst-case scenario.
Low
Risk
A visual three-bar rating. An aggregated, simplified indicator for the less sophisticated investor — no need to know what Sharpe or Sortino mean.
191
Trades
Total closed trades. Tells you whether the return came from 12 lucky entries or 191 systematic ones — a sample-size sanity check on every other number.
$19.8K
Equity, USD
Capital currently on the master's own account. Investors trust strategies where the master still has real skin in the game.
24/03/2026
Active Since
When the account first traded. An “Active Since” line is a strong trust signal — this isn't a freshly-opened account chasing followers.
17 / 100
Score
B2COPY's proprietary aggregate rating — return, risk, consistency and trade count rolled into a single 0–100 number. Powers leaderboard ranking and gives investors a fast “should I read the rest?” signal.
03 · Performance chart
Performance Overview — The Central Visual Argument
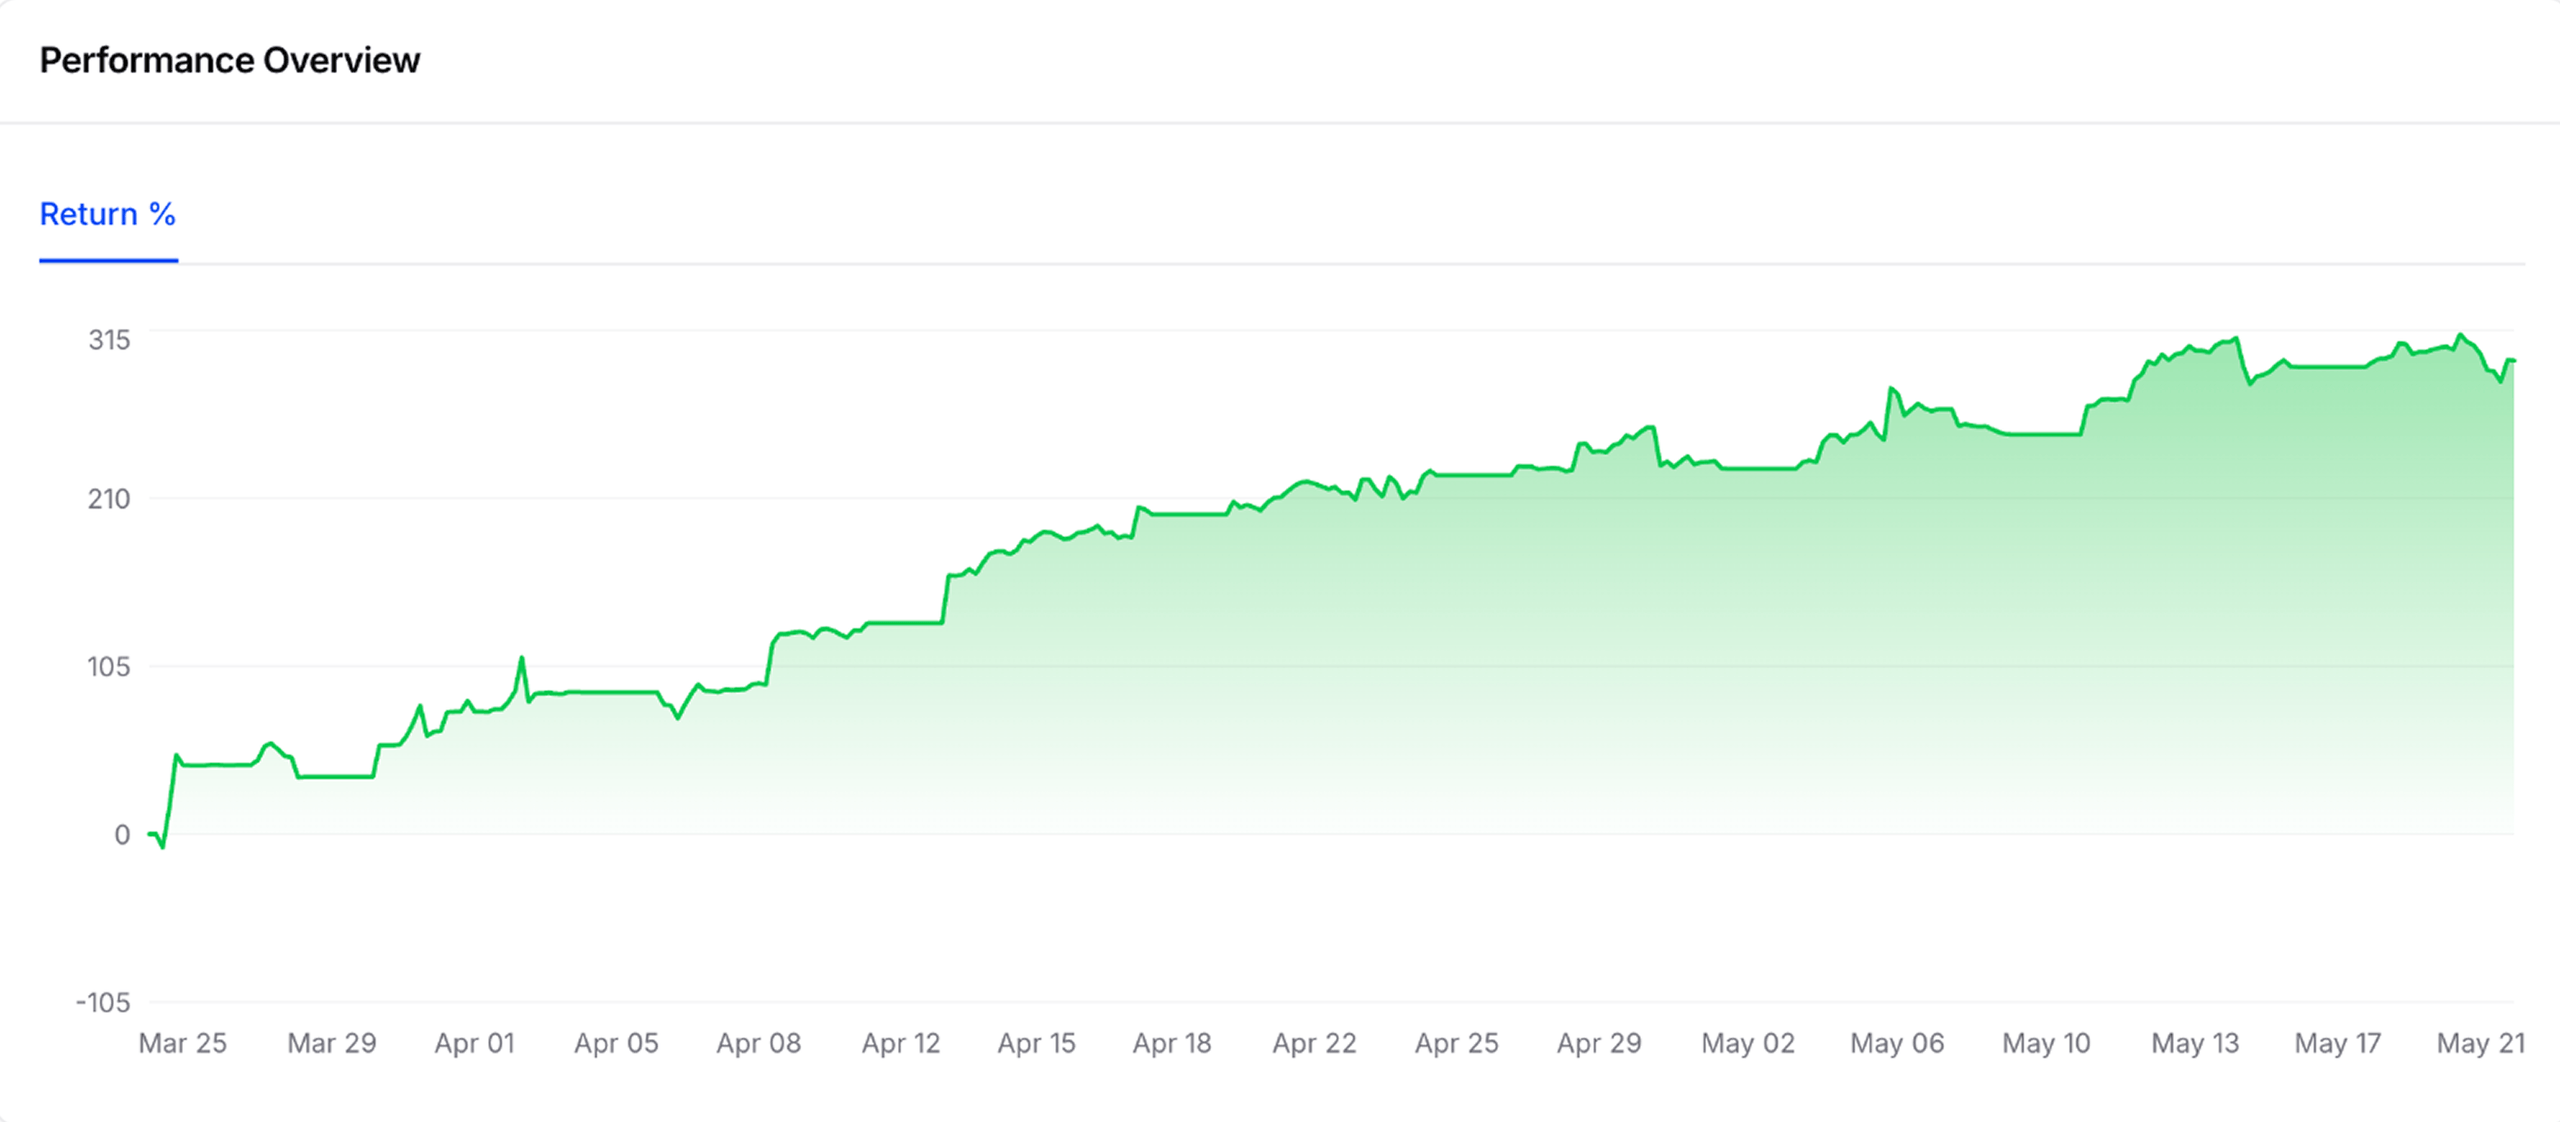
Return dynamics over the selected period, filled green area, precise date grid on the X-axis, percentage scale on Y. The chart spans nearly the full width of the card — because it sells the master better than any description.
A Green Slope Going Up Is an Emotional Trigger
Investors look at the shape of the curve and decide faster than they read any number. A smooth, rising line without large drops equals trust.
Metric Toggles, Minimum Clicks
Return %, drawdown and other slices switch in-place without leaving the page. Minimum clicks, maximum information — investors stay on the master’s card instead of bouncing.
A Precise Date Scale
Mar 25 → May 21 in 4-day steps. The investor can map curve movements onto specific market events and see how the master behaves under stress.
Honest Y-Axis, Including the Loss Zone
The Y-axis runs from negative to positive — even the loss zone is visualised. Investors see up front that drawdowns can go below zero and decide for themselves whether they can stomach it.
04 · Followers & AUM
Social Proof in Three Numbers
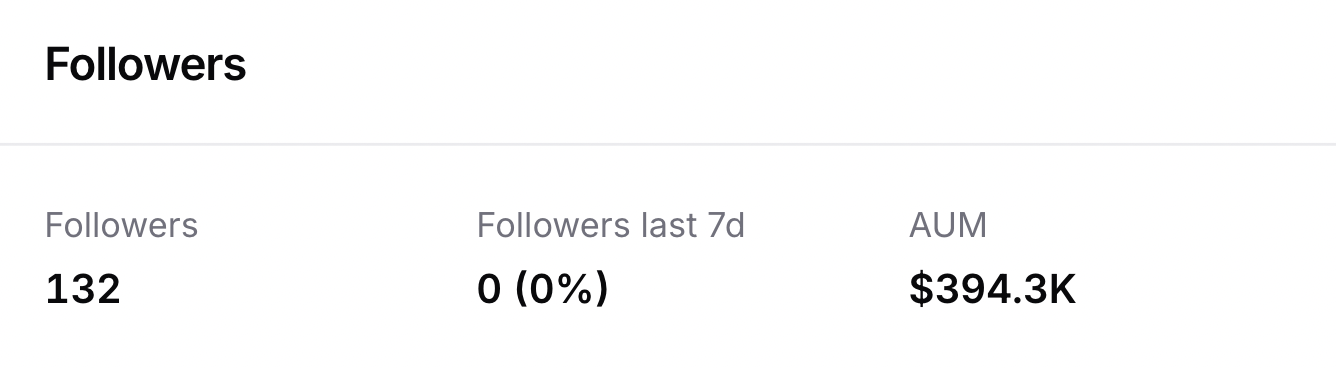
Three simple figures that act as powerful psychological triggers for the investor — and a built-in ranking mechanism for the broker. Top masters automatically attract attention through high follower counts and AUM; new masters see exactly what they are aiming for.
132
Followers
Not just a number — a signal that 132 people before you have already voted with their money for this master. Pure social proof, and it drives follow conversion better than any marketing copy.
+0 (0%)
Followers Last 7D
Growth trend over the past week. A rising master looks more attractive than a static one even at the same return — investors want to catch the wave, masters watch the counter to confirm their card is gaining traction.
$394.3K
AUM
Total capital from subscribers currently copying this master. The higher the AUM, the higher the trust — and for the broker, an indirect indicator of how much performance-fee volume this master generates.
05 · Profit Summary
Realized P/L and Daily Extremes — For Deeper Analysis
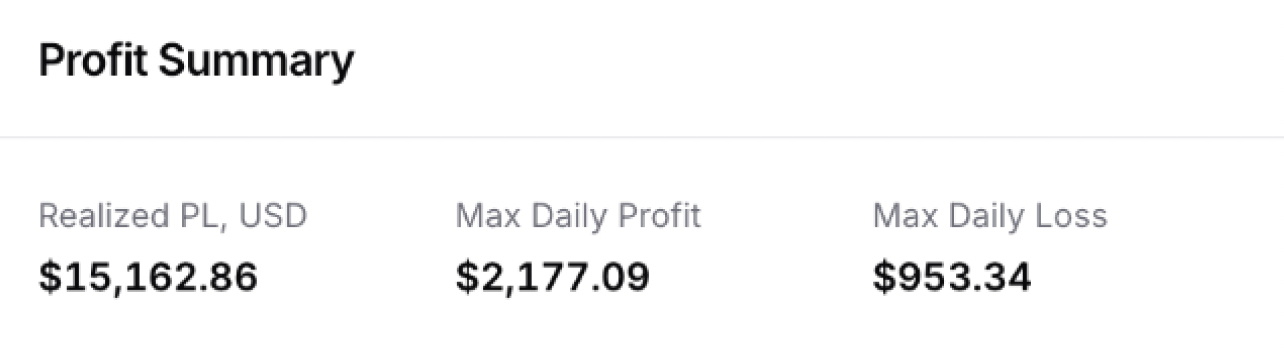
Three numbers that separate a surface-level investor from one who actually knows how to evaluate risk: Realized P/L, Max Daily Profit, and Max Daily Loss. The ratio of best day to worst is a quick asymmetry signal — does the master earn more on their best days than they lose on their worst?
$15,162.86
Realized P/L, USD
Actual money the master has earned on closed trades. Not “paper” returns, not floating positions — concrete results. For the investor, an anchor of honesty separating real performance from open-position fantasy.
$2,177.09
Max Daily Profit
The best single day on record. Shows the upside and the master's ability to catch large moves — useful context for an investor sizing their first deposit against a realistic best-case day.
-$953.34
Max Daily Loss
The worst day. The most important number in the block — the investor can ask directly: if a day like that hits tomorrow, would I lose an acceptable amount? Far easier to digest than abstract risk talk.
06 · Monthly Return
Consistency of Results, Month by Month
A monthly return histogram with a year selector. Helps the investor distinguish a one-off lucky run from systematic trading — and motivates the master to stay consistent month after month rather than chasing one-off sprints.
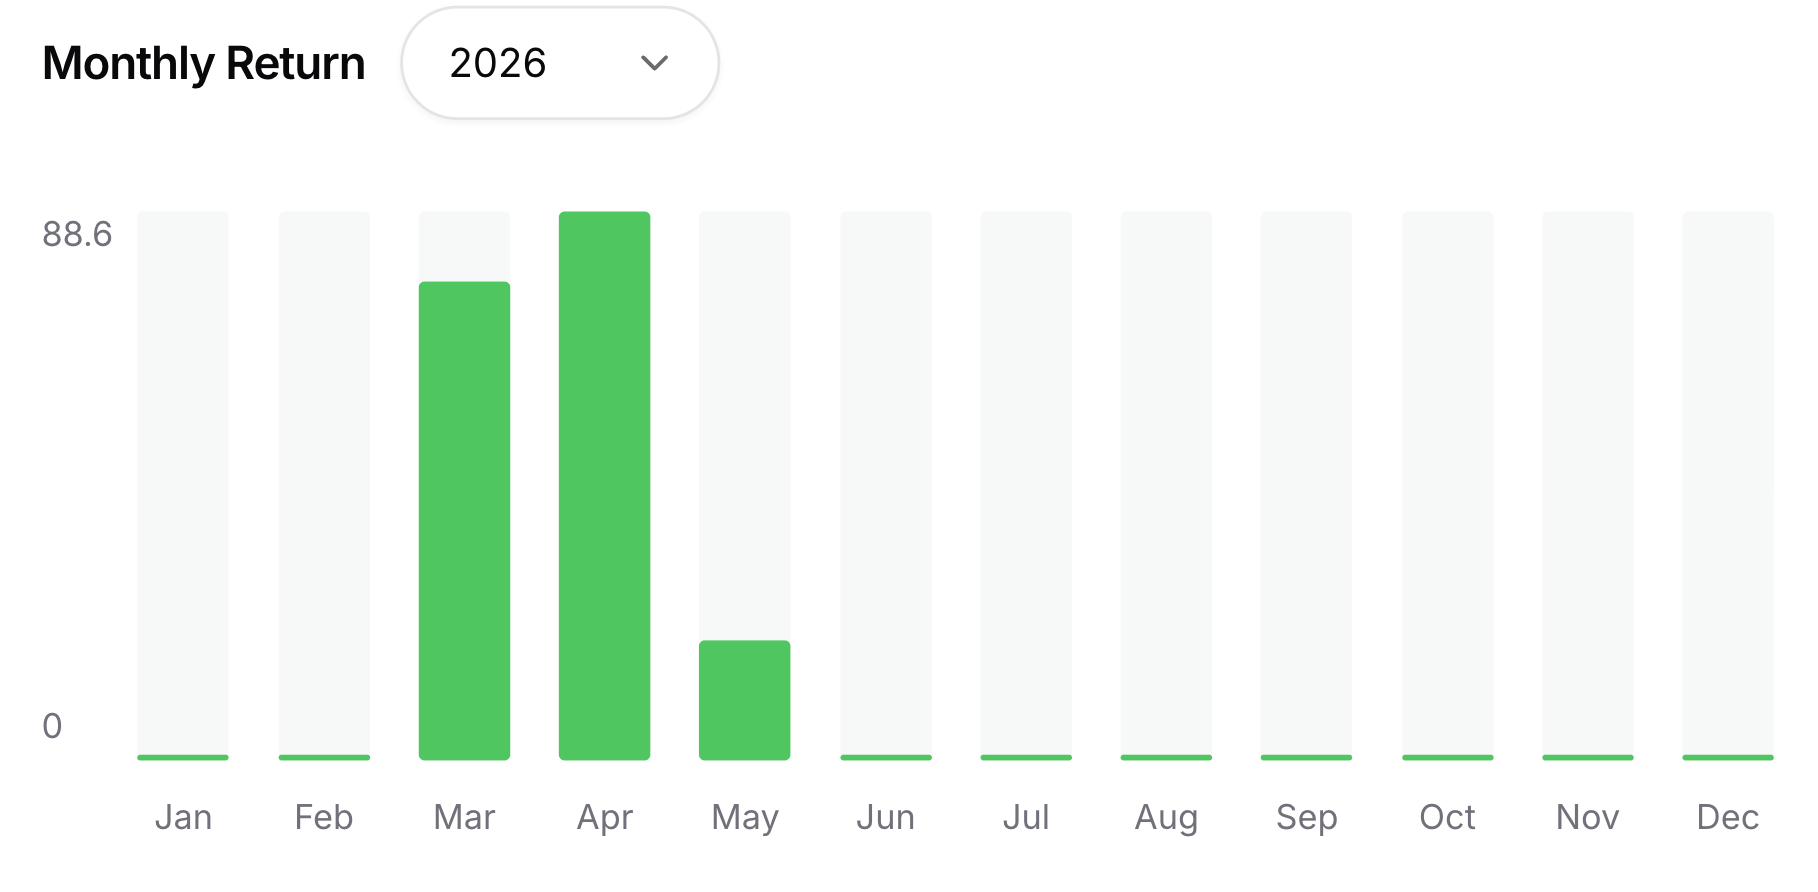
One Big Month vs a Row of Empty Bars
One 88% bar surrounded by ten empty months isn't a consistent trader — it's a lucky one. The monthly histogram exposes the pattern instantly. And vice versa: a row of steady green bars is the hallmark of a systematic approach.
Year Selector — Track Record Depth
The 2026 dropdown lets the investor pull up historical data for prior years. The longer the record they can browse, the higher the trust — and the harder it is to fake.
Colour Coding — Green / Red Months
Green bars for profitable months, red where present for losing ones. The ratio of profitable to losing months is an excellent at-a-glance quality signal that needs no maths from the investor.
Honest Y-Axis, Starting at 0
The Y-axis starts at 0 — no clipped baselines that make a small number look big. Part of the B2COPY honest-visualisation culture: the chart sells the strategy on substance, not on tricks.
07 · Trading Instruments
Where Exactly the Master Makes Money
Instrument list with percentage allocations and a donut chart with the instrument count in the centre. Shows the master's specialisation in one glance — focused strategy or scattergun across 50 pairs.
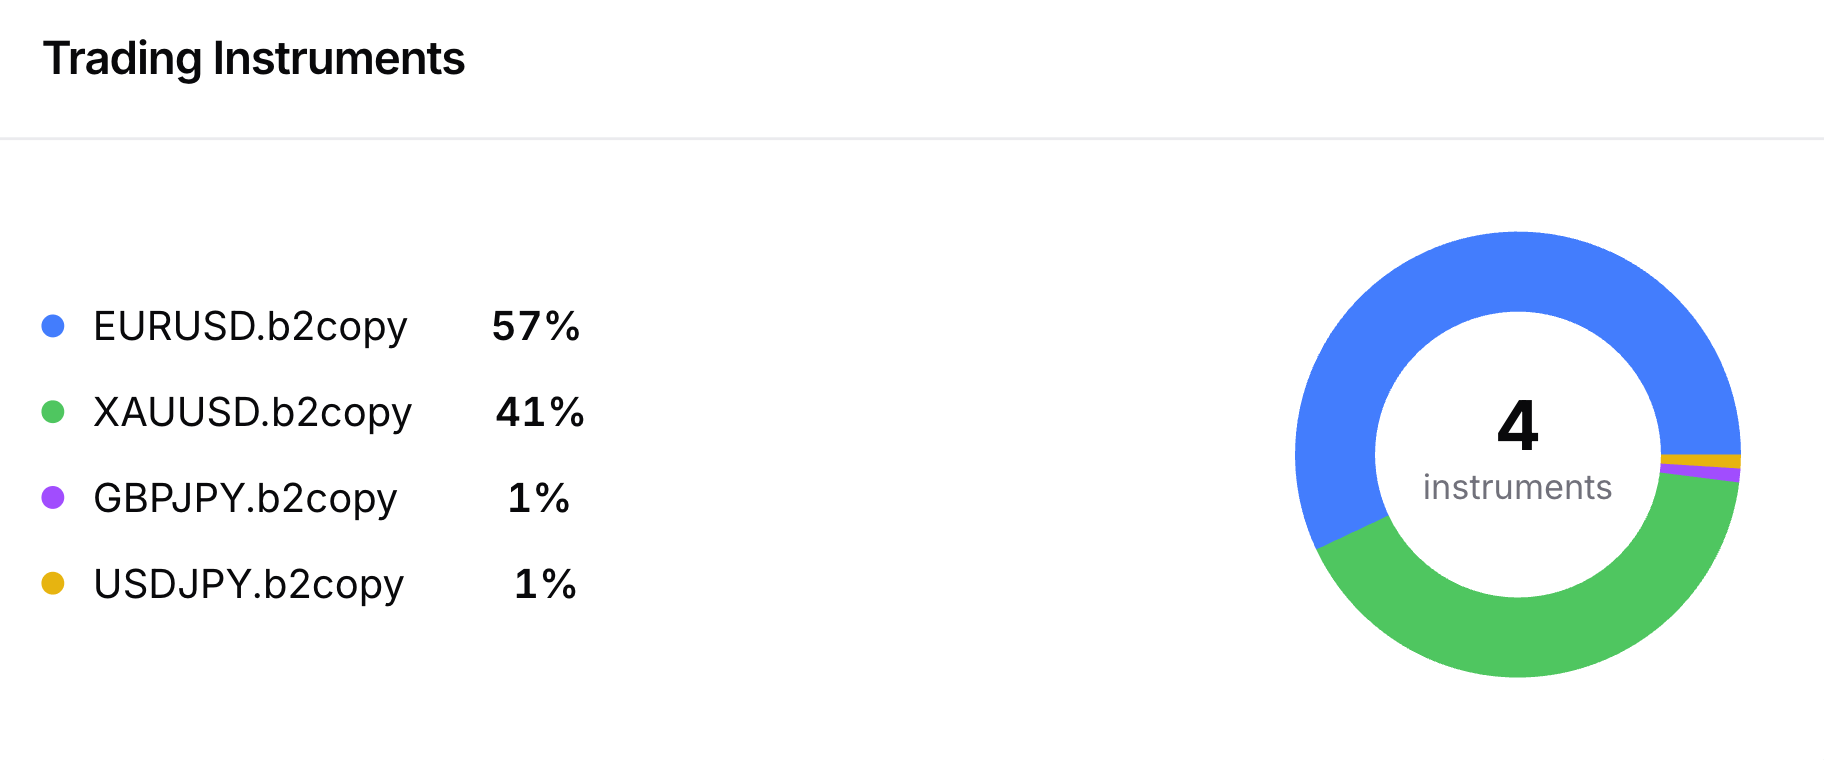
Specialisation, Not Scattergun
EURUSD 57% and XAUUSD 41% means this master is focused on two instruments — a focused strategy, not a random spray across fifty pairs. Focus on 2–3 instruments often reads as professionalism.
4 Instruments Badge — Diversification Check
The “4 instruments” counter in the centre of the donut answers “how diversified is this trader?” at a glance. One instrument = high concentration risk; twenty-plus = possibly chaotic scalping with no clear system.
Portfolio Fit for the Investor
Investors who already hold copy subscriptions check this block before adding a new master. If three of their masters already trade EURUSD, a fourth EURUSD-heavy master adds zero diversification.
Analytical Lens for the Broker
Cross-master instrument data is also a broker tool — see which symbols are popular among top masters and optimise spreads, marketing and educational content around them.
08 · Trading Statistics
A Full Analytical Cross-Section of How the Master Trades
Number of trades, average frequency, time in position, consecutive streaks, buy/sell balance, profitable weeks. The deep-stats block is for investors who make decisions on numbers, not on vibes — and for masters who want a full self-check on every weak spot.
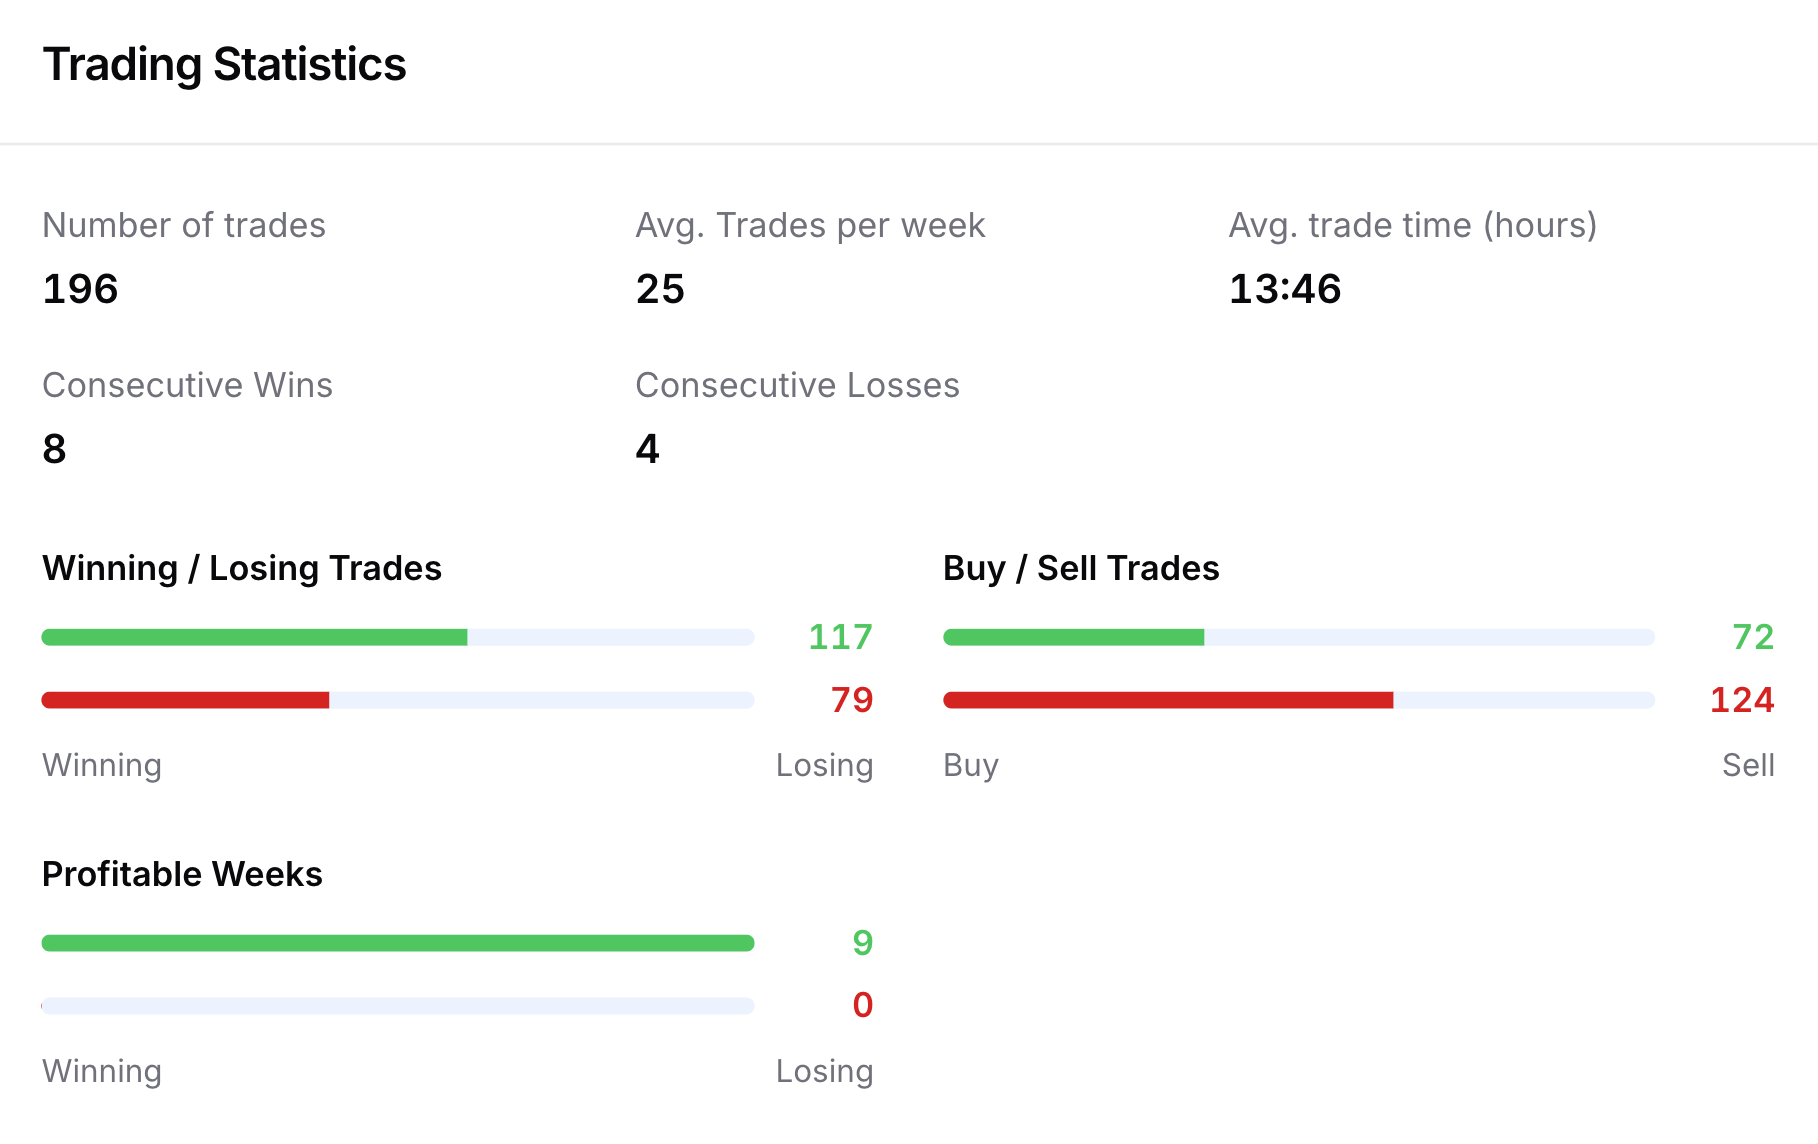
196
Number of Trades
The master is active and trading systematically — not one-off entries but a steady flow. Sample size for every other behavioural metric in the block.
25
Avg. Trades per Week
Trading cadence. Lets the investor identify the style — scalping (many small entries), intraday (a handful), swing (a few per week). 25 trades/week points to active intraday.
13h 46m
Avg. Trade Time
Average holding time per position. The fastest way to identify the style: minutes = scalping, hours = intraday, days = swing. 13 hours points to classic intraday with overnight holds.
8 / 4
Consecutive Wins / Losses
Longest winning and losing streaks. If the max losing streak is 4, the investor can estimate the psychological and capital buffer they need. For the master, a target — reduce the worst streak, hold the longest one.
117 / 79
Winning / Losing Trades
Ratio of winners to losers in raw numbers, not just percent. A ~60% win rate combined with a 2.85 profit factor is a strong pairing — the investor sees both the ratio and the sample.
72 / 124 · 9 / 0
Buy / Sell + Profitable Weeks
Directional balance (this master shorts more than they go long) plus a weekly consistency check — 9 profitable weeks against 0 losing weeks is a strong signal over a short timeframe. No vibes, just bars.
09 · Trading history & open positions
Full Transparency on Every Single Trade
A table with the complete trade history — symbol, volume, open and close dates, times, swap, profit, position ID. Plus a separate tab for currently open positions. The audit trail behind every aggregate number on the page.
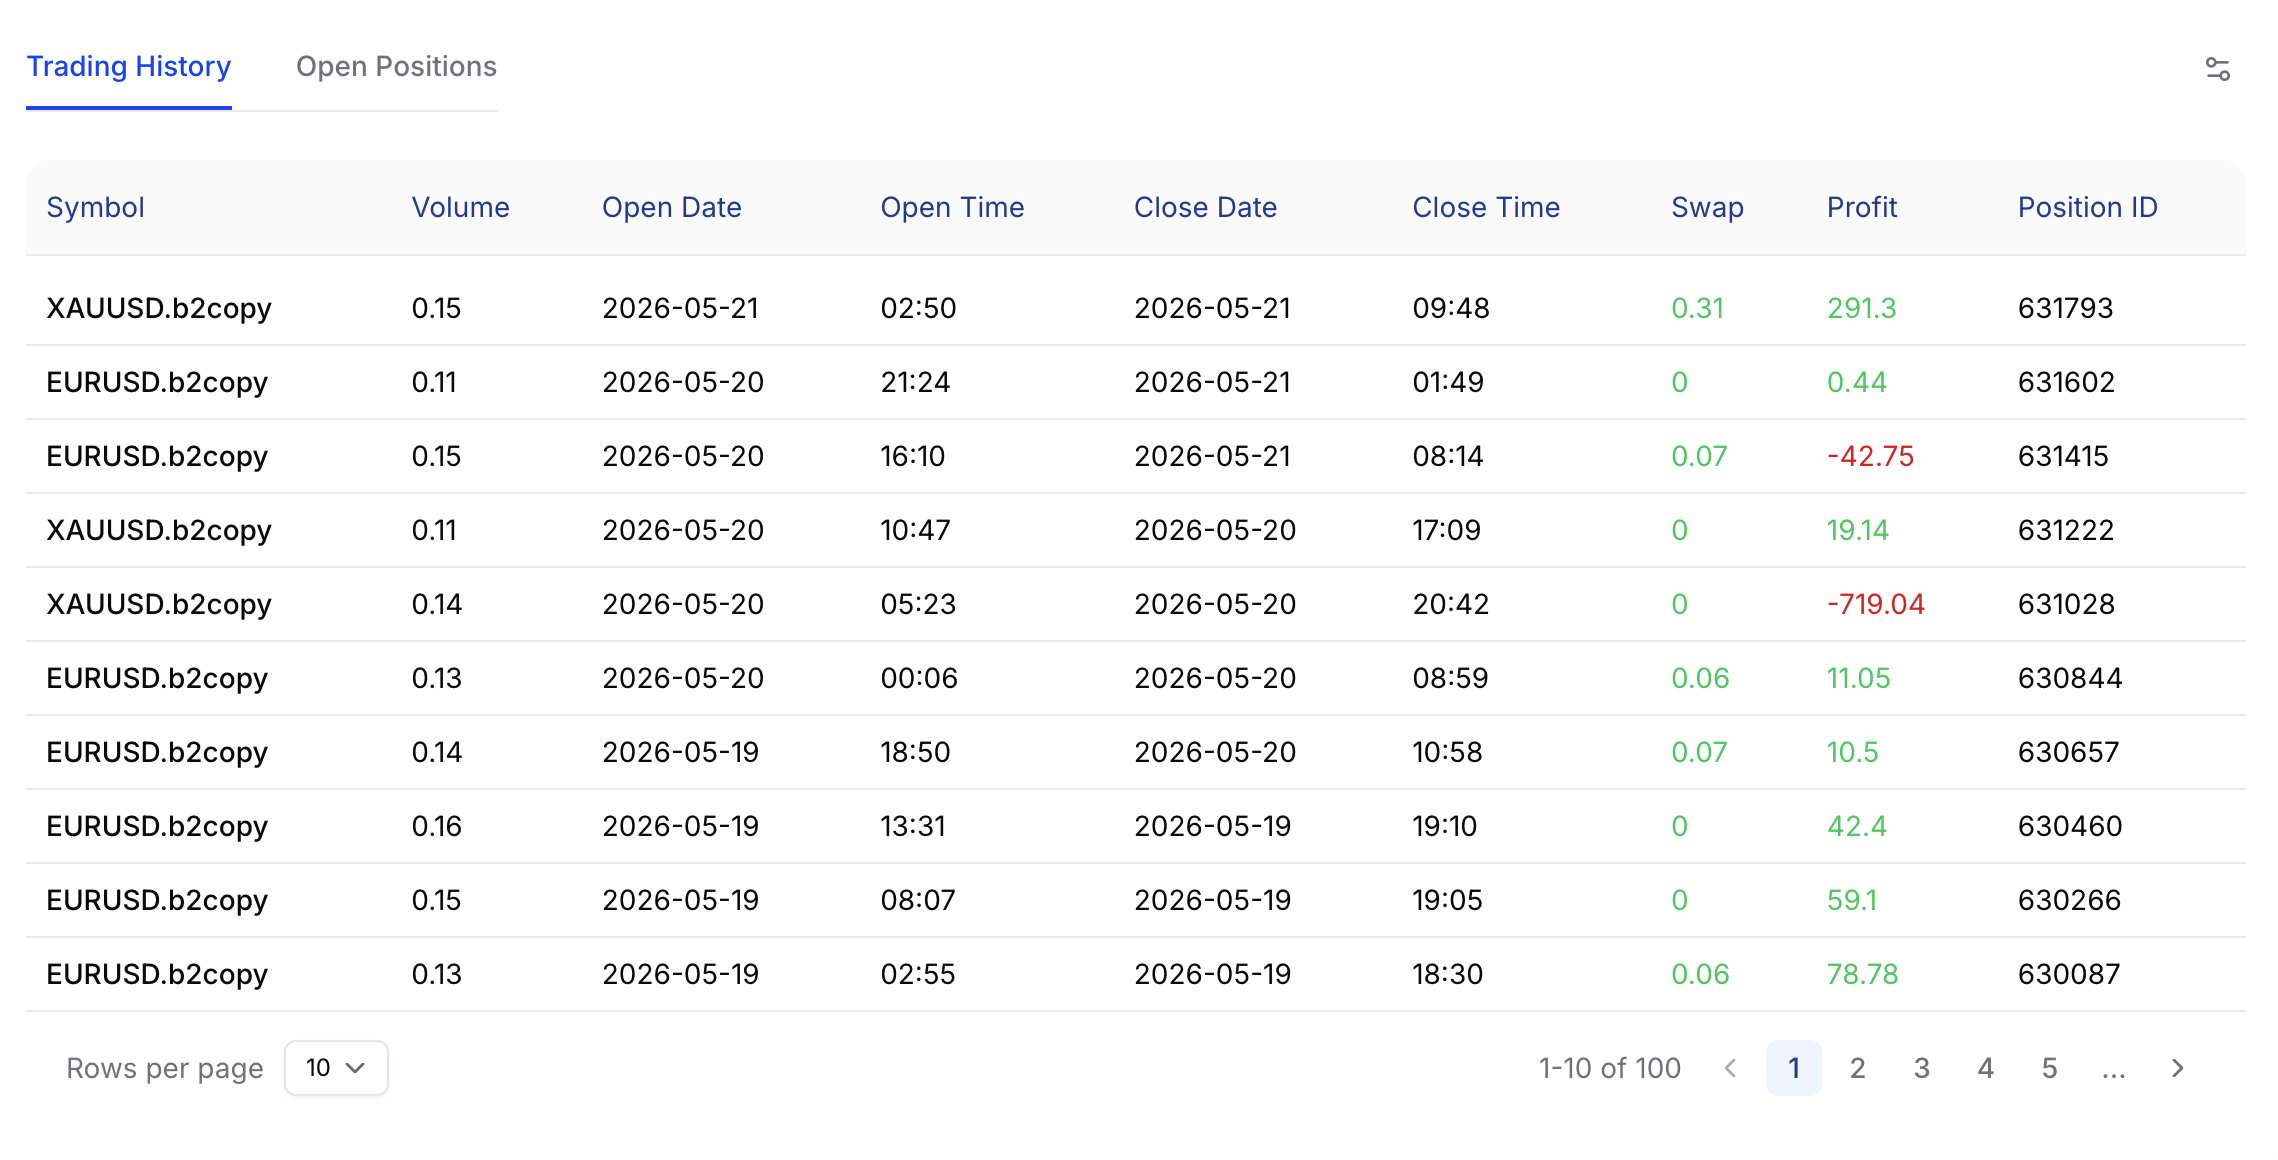
A Row per Trade, a Position ID per Row
Symbol, Volume, Open Date/Time, Close Date/Time, Swap, Profit, Position ID — every closed trade as one auditable line. Position ID is critical for audits and dispute resolution: the investor references a specific ID when they have a question.
Swap Shown Separately
Swap sits in its own column so the investor sees the real cost of holding the position — important for long-held trades and masters who keep positions overnight or over weekends.
Colour-Coded P/L + Buy/Sell Tabs
Profit column rendered green for winning trades, red for losing ones — a glance down the table gives an instant feel for the win/loss balance. The Open Positions tab shows what the master is holding on the market right now.
Pagination + Filters — No Cherry-Picking
Pagination through the entire history (1–10 of 100, with classic page navigation) — no hidden trades, no curated highlights. A filter icon slices trades by instrument, period or P/L for analysts who want to take the strategy apart down to the bone.
Summary
What This Page Means for the Broker’s Business
Deep, honest, well-visualised statistics aren't just a “feature”. They are the infrastructure of trust on which a copy-trading business is built. Higher trust → higher client LTV → lower churn → cheaper acquisition through referrals and social proof.
Lower Churn
Investors who understand what they bought don't panic at the first drawdown. Deep statistics reduce emotional unsubscribes — the curve, the description and the daily-loss number prepare investors for what real trading looks like.
RetentionHigher Conversion
A Follow button in the header, social proof via follower counts, clean charts and an honest Y-axis — everything shortens the path from view to subscription. More “I like this” moments convert before the doubt sets in.
ConversionLower Regulatory Risk
Transparent fees, an open strategy description, accessible trade history — built-in protection against “I was misled” complaints. The page itself documents the disclosure the regulator expects to see.
ComplianceLower Support Load
When everything about a master sits on one page, investors stop pinging support with “how much does he earn?”, “what's his strategy?”, “why was 20% deducted?”. Tickets drop, your team gets back to higher-value work.
SupportMasters Stay with You
A high-quality profile page is the master's own tool. Moving to a less polished, less functional platform isn't an attractive trade — the page becomes a switching cost in your favour.
Master retentionReady-Made Marketing Assets
Top masters' cards are ready-to-use stories for social posts, email campaigns and PR. Marketing gets content out of the box — every breakout strategy is a case study waiting to be packaged.
Marketing10 · Strategy description
The Master Explains, in Their Own Words, How and Why They Trade
A free-form text block filled in by the master. Trading style, instruments, risk parameters, philosophy. The things numbers can't express but that are critical to a subscription decision.
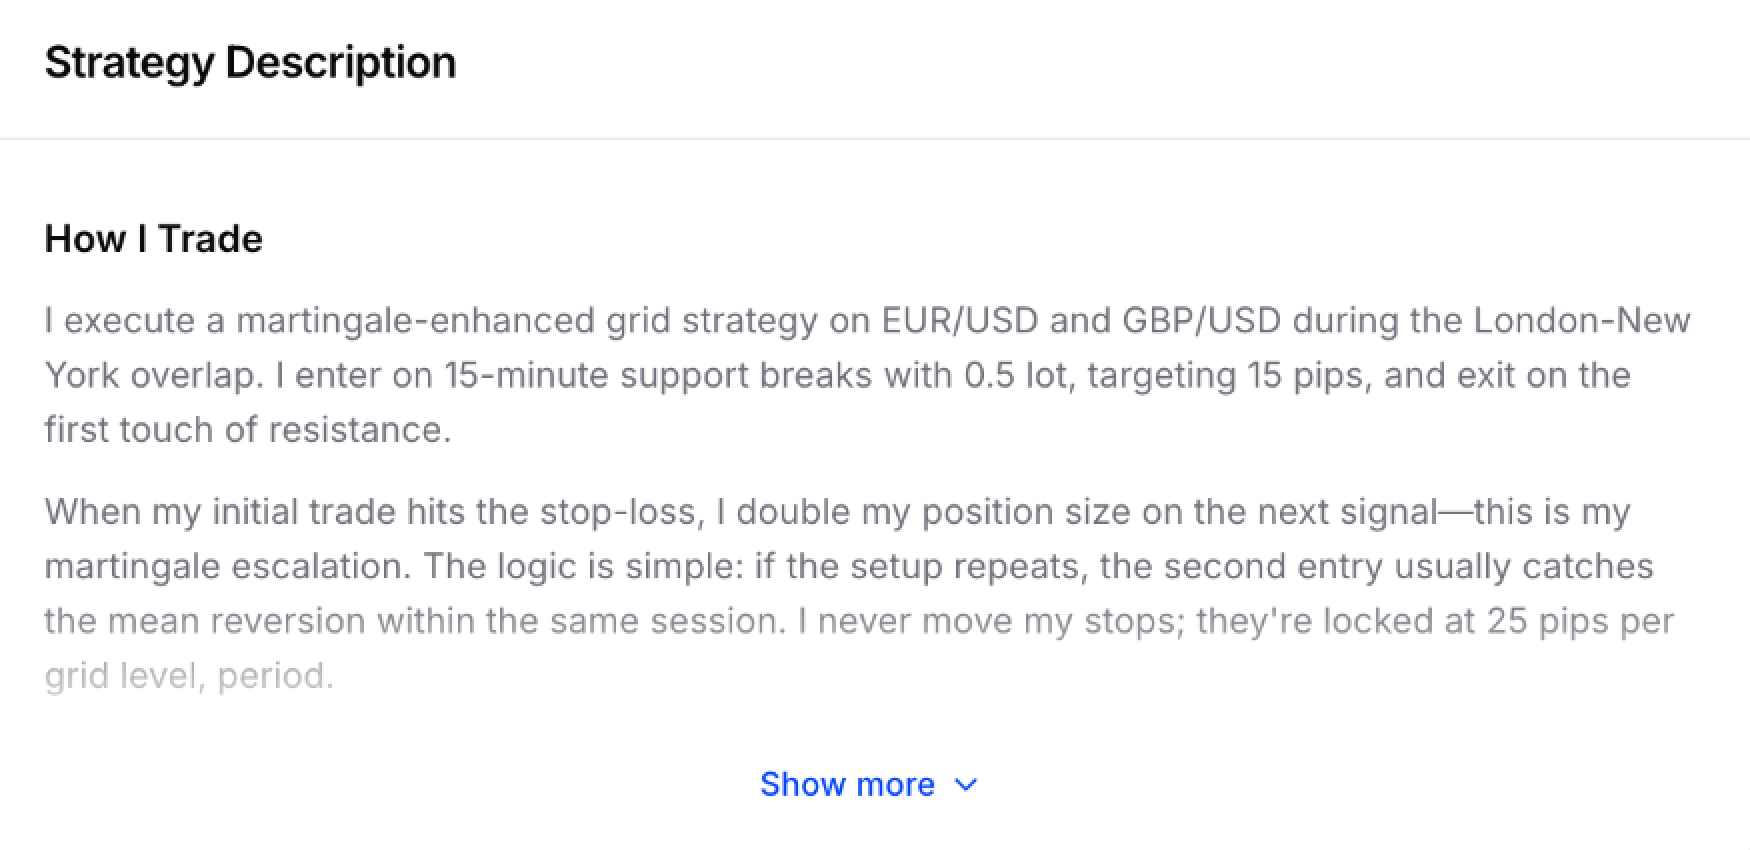
Two Sentences and the Investor Knows the Strategy
“I execute a martingale-enhanced grid strategy on EUR/USD and GBP/USD during the London-New York overlap…” — two lines tell the investor the instruments, the session, the risk approach.
- Long descriptions don't break the layout — a “Show more” toggle expands the text on click, so the master can write as much as they want.
- An additional layer of protection: if the master openly declares martingale, the investor subscribes with informed consent. Fewer “I didn't know he was risking like that” complaints in support.
- A strong marketing asset — masters with distinctive strategies become “stars” of the platform, and their cards plug straight into case studies, social posts and email campaigns.
11 · Fee structure
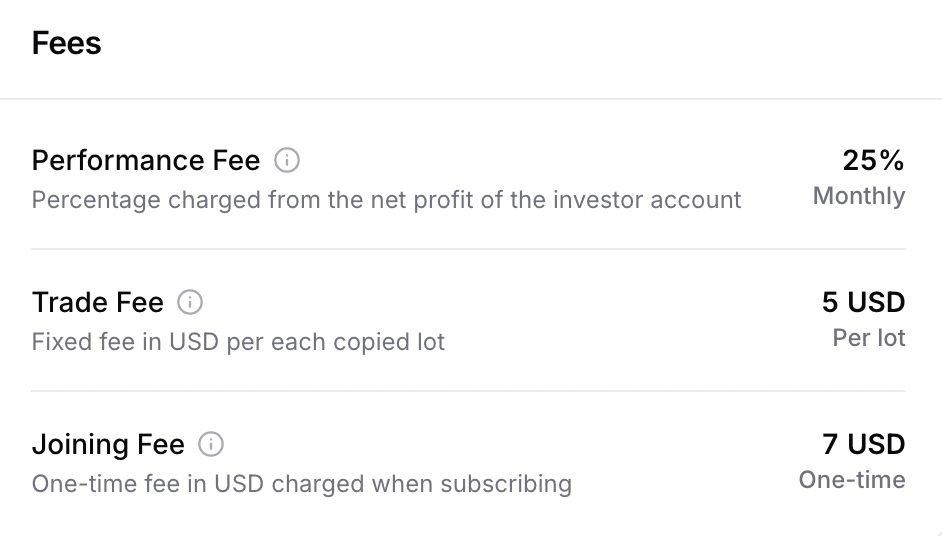
Performance Fee — Transparent and Clear from the First Second
A dedicated Fees block that states exactly how much the master charges, on what, and how often. No hidden footnotes, no asterisks, no end-of-month surprises.
Disclosure That Protects Everyone
- Performance Fee 20% — large, prominently placed, with a tooltip that reads “percentage charged from the net profit of the investor account.” No room for misinterpretation.
- Periodicity Monthly — the charging cadence is explicit. The investor instantly knows the fee is debited once per month, not on every trade — critical for calculating real net return.
- An “i” icon opens a longer explanation for investors seeing copy trading for the first time. Fewer “why was 20% deducted?” tickets in your support queue.
- Regulatory risk protection: the fee policy is openly disclosed before subscription. An investor cannot later claim “I wasn't warned.”
- Flexible schemes supported: performance fee, management fee, fixed charges, multiple periodicities. Each master configures their own model — transparency is the only non-negotiable.
12 · Profit Factor
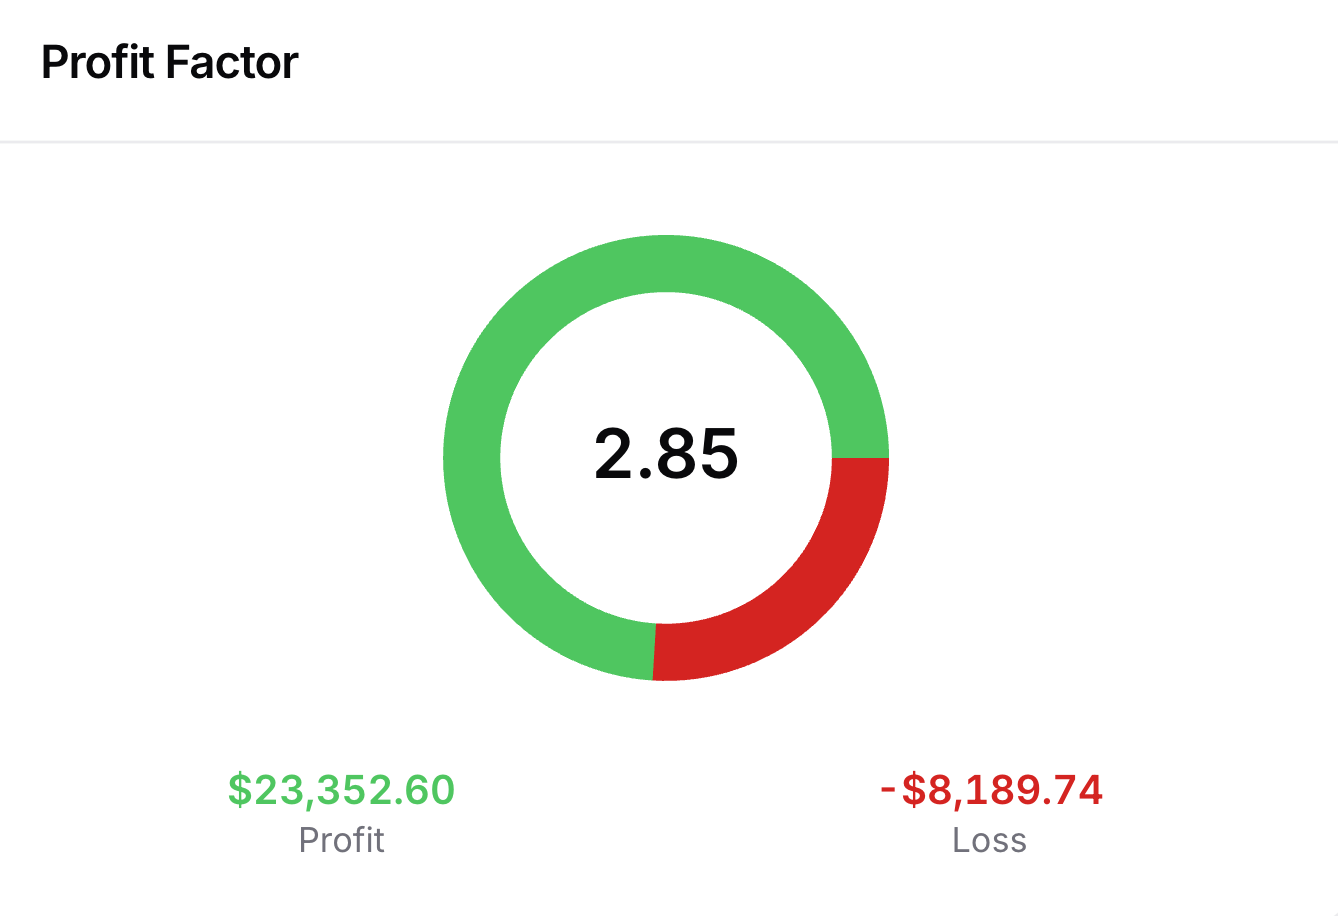
Profit Factor 2.85 — A Donut That Replaces Ten Lines of Numbers
Profit-to-loss ratio shown as a donut chart with the underlying dollar amounts beneath it. One of the most important quality metrics for any trading strategy — and one of the easiest to read.
Visualisation Makes a Complex Metric Accessible to Everyone
- Profit Factor 2.85 means that for every dollar of loss the master earned $2.85 in profit. Context: above 1.5 is already good, above 2.0 is excellent, above 3.0 is outstanding.
- The donut chart with green and red sectors makes the ratio land in half a second. The dominant green slice is the emotional signal that “profit overwhelms losses.”
- Below the chart sit the concrete figures: $23,352.60 Profit / -$8,189.74 Loss. Investors who want the underlying dollars get them; investors who only need the gist get the donut.
- Especially useful for experienced investors and arbitrageurs who compare masters not by return but by the quality of their recovery from losses.
Frequently Asked
FAQ
No. The statistics page is computed from the executed trade journal — the same data the broker uses to settle accounts. Masters can edit their Strategy Description text and adjust their fee schedule going forward, but they cannot change any historical metric, hide a losing month or reset a drawdown.
Live KPIs (Return %, Equity, Profit Factor, open P/L) update on every executed trade and equity tick. Time-bucketed views (Monthly Return, Profitable Weeks) recalculate at the end of each bucket. Historical figures like Max Drawdown are immutable — once set, they remain in the record.
Yes — by design. The investor leaderboard, the master's own profile and the broker admin panel all pull from the same metric service. The only difference is access scope: brokers see Fees Earned and cross-master comparison tables that investors do not.
The Score is a composite 0–100 rating that blends risk-adjusted return, drawdown depth, trade-frequency consistency and sample size. It is exposed primarily to help investors filter and rank — never as a substitute for reading the underlying KPIs.
The same statistics page works for master accounts on MetaTrader 4, MetaTrader 5, cTrader and B2Trader. Cross-platform investors see the same KPIs regardless of which engine the master is running on.
Yes. Every metric and the full trade history are available via REST and WebSocket APIs, and the trade-history table has a CSV export button. Brokers can pipe the same data into their BI stack — Looker, Tableau, Metabase, or anything else that speaks SQL.
Yes. Brokers can hide individual KPIs and blocks at the tenant level — for example, suppressing the Risk Score on accounts subject to specific local marketing rules, or hiding Fees Earned from investors entirely. The underlying calculation always runs; only the rendering is gated.
Explore more
See Related Capabilities
6 Fee Types
Performance, management, subscription, volume, joining, and profit fees.
Learn moreRisk Management
Daily limits, max drawdown controls, and personal loss limits.
Learn morePosition Sizing
Six allocation methods — proportional, ratio multiplier, or fixed lot.
Learn moreMulti-Server Copying
Copy trades across MT4, MT5, cTrader, and B2Trader servers.
Learn moreIntegration Options
Widget SSO, CRM integrations, REST, and gRPC APIs.
Learn more
This Is Just One Page from the Platform
The full B2COPY toolkit includes the Leaderboard, investor Dashboard, master cabinet, MAM and PAMM modules, billing and commission engine, REST API, and an admin panel for the broker.