What is the Beta Coefficient in Trading?

A keen knowledge of risk management is more than important for dealing with the complications of the stock market. Among the various tools at an investor’s disposal, the beta coefficient stands out as a crucial metric for assessing market-related risk. This numerical value serves as a barometer, measuring how volatile an individual stock or asset is in relation to the broader market.
Let’s delve into the intricacies of the beta coefficient, explore its calculation methods and highlight its significance for both seasoned traders and novice investors. We’ll examine how Beta interacts with other key financial concepts, including price volatility, the capital asset pricing model (CAPM), and the potential returns on investments. By understanding Beta, investors can better align their risk tolerance with their investment strategies, potentially leading to more balanced and profitable portfolios.
Key Takeaways
- The beta coefficient measures how volatile a stock is compared to the overall market. A higher beta indicates more price volatility, while a lower beta signifies less risk.
- Investors use the beta coefficient to balance their portfolios between high-risk, high-reward stocks and more stable, low-beta stocks.
- Beta helps investors assess systematic risk, enabling them to determine how much their portfolio is exposed to market fluctuations.
Understanding Beta Coefficient in Trading
The beta coefficient, often referred to as “beta,” is a statistical measure that compares the volatility of an individual stock or portfolio to that of the entire market. It gives investors valuable insights into how a particular security will likely respond to market movements, helping them gauge potential risks and returns.

A beta value can be positive or negative, with positive values indicating that the stock moves in the same direction as the market and negative values suggesting that the stock moves in the opposite direction.
Here’s a breakdown of how Beta works:
- Beta = 1: The stock’s price moves in line with the market. If the market rises or falls by a certain percentage, the stock is expected to move by the same amount. This represents a typical, balanced risk-return profile. For example, if the market increases by 10%, the stock would likely also increase by 10%. Conversely, if the market drops 10%, the stock would likely drop by 10% as well.
- Beta > 1 (High Beta): The stock is more volatile than the overall market. High-beta stocks amplify market movements, which means they tend to see larger gains during market rallies but also steeper declines during downturns. For example, a stock with a beta of 1.5 would likely rise 15% if the market goes up by 10%, but it could also drop 15% during a 10% market decline.
- Beta < 1 (Low Beta): The stock is less volatile than the market, meaning it tends to rise and fall less dramatically than the market. While these stocks might not offer the high returns of more volatile stocks, they can provide greater stability and act as a buffer during market declines. For example, a stock with a beta of 0.8 might increase by only 8% if the market rises 10%, offering a smoother ride during market swings.
- Beta < 0 (Negative Beta): This is a rare situation where a stock moves in the opposite direction of the market. Negative-beta assets can serve as effective hedges against market downturns, as they typically rise when the market falls. Examples of assets with negative beta include certain inverse ETFs or precious metals like gold, which often perform well during market declines.
It’s important to remember that Beta is a historical measure and doesn’t guarantee future performance. However, it provides valuable insights into an investment’s risk profile and potential price movements based on past behaviour.
Beta Coefficient Calculation
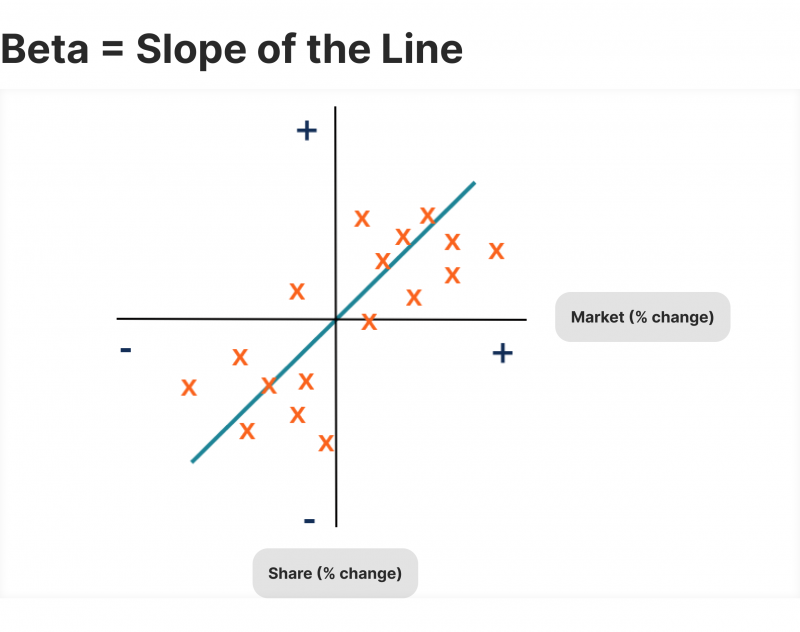
Beta is calculated using a statistical technique called beta regression. This process involves analysing historical price movements of the investment and a chosen market index (e.g., S&P 500) to determine the co-movement between the two. The resulting beta value reflects the slope of the regression line established through this analysis.
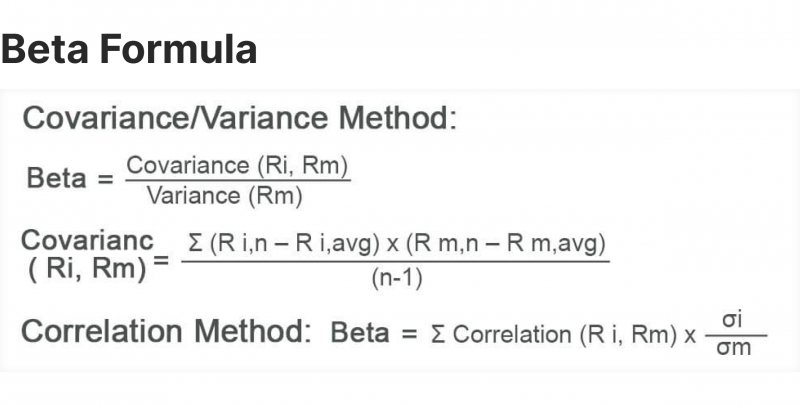
Understanding the calculation process can enhance your understanding of how Beta is derived. The formula for Beta is as follows:
Beta = Covariance (Stock’s Returns, Market’s Returns) / Variance of Market Returns
This calculation shows a single number representing the stock’s sensitivity to market movements.
Explore Deeper Industry Insights
Learn from experts shaping the future of financial services — get the latest strategies and trends.
How to Calculate Beta Coefficient of a Stock
To calculate the beta coefficient of a stock, follow these steps:
- Gather historical price data for the stock and the market index (e.g., S&P 500) over a specific period. This data includes stock price movements and market index movements.
- Calculate the periodic returns for both the stock and the market index.
- Use a spreadsheet or statistical software to perform regression analysis.
- The slope of the regression line represents the stock’s beta regression coefficient.
Many financial websites and stock screeners provide pre-calculated beta values for stocks, simplifying the process for investors.
Alpha and Beta are historical measures of past performances. Alpha shows how well (or poorly) a stock has performed compared to a benchmark index. Beta indicates how volatile a stock’s price has been compared to the whole market.
Beta Coefficient in Stocks
Understanding the beta coefficient in stocks helps investors assess how much risk they are exposed to when they invest in individual stocks. Stocks with high betas can deliver higher returns but are also associated with higher risk due to increased price volatility.

On the other hand, low-beta stocks are less volatile and are often favoured by conservative investors. For instance, utility stocks typically have low betas because their prices don’t fluctuate as much as growth stocks.
Gold Beta Coefficient
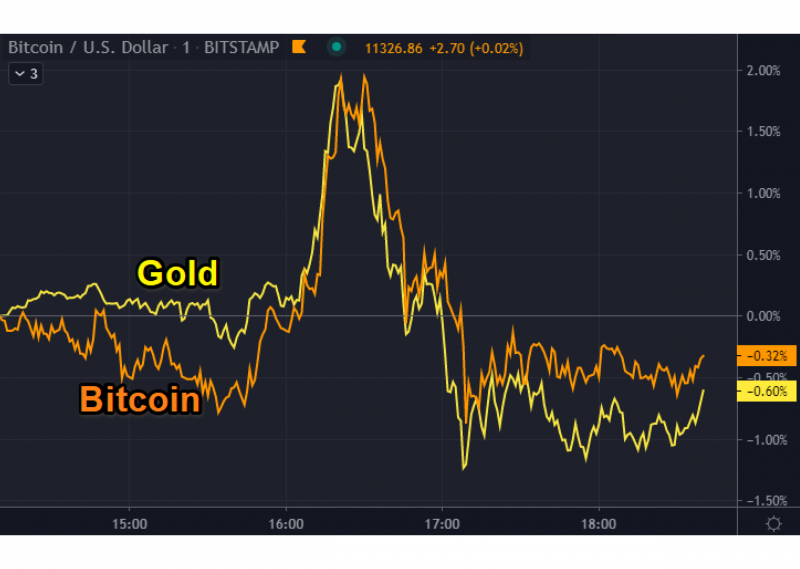
Gold is often considered a safe-haven asset and typically has a low or negative beta coefficient relative to the stock market. This means that gold prices usually move independently or in the opposite direction of the broader market, making it a popular choice for portfolio diversification.
Gold vs BTC Beta Coefficient

Comparing the beta coefficients of gold and Bitcoin (BTC) can provide insights into their respective relationships with the stock market:
- Gold: Generally has a low or slightly negative beta, often moving independently of stock market trends.
- Bitcoin: Has shown a higher and more volatile beta, sometimes exhibiting a positive correlation with the stock market during periods of extreme volatility.
Investors should note that these relationships can change over time and may vary depending on market conditions.
Beta Coefficient Correlation and Market Risk
The beta coefficient is closely related to correlation, but they are not the same:

- Correlation measures the strength and direction of the linear relationship between two variables.
- Beta measures the sensitivity of a stock’s returns to changes in market returns.
A stock can have a high correlation with the market but a low beta if its price movements are consistently smaller than the market’s.
Capital Asset Pricing Model (CAPM) and Beta
The beta finance formula is an essential component of the Capital Asset Pricing Model (CAPM), which is a fundamental concept in finance that uses Beta to determine the expected return of an asset. The equation for CAPM is as follows:
Expected Return = Risk-Free Rate + Beta × (Market Return – Risk-Free Rate)
Beta represents the asset’s riskiness in this model compared to the broader market. A high beta stock has higher growth potential but is more volatile, while investors may prefer low beta stocks for stability and less volatility.
Discover the Tools That Power 500+ Brokerages
Explore our complete ecosystem — from liquidity to CRM to trading infrastructure.
How to Use Beta Coefficient in Portfolio Management
Beta plays a critical role in portfolio management, as it helps investors assess their investments’ overall risk and volatility. Investors can balance growth potential with risk management by selecting a mix of low-beta and high-beta stocks. A portfolio with a weighted average beta close to 1 typically aligns with the overall stock market.
However, depending on market conditions and risk tolerance, some investors may prefer low-beta stocks to reduce exposure to market volatility, especially during uncertain times.
In corporate finance, Beta is used to evaluate business risk and assess the cost of equity funding. A higher beta suggests a company is riskier and may have to pay higher returns to attract investors. Levered beta accounts for a company’s debt levels, while unlevered Beta excludes the impact of debt, providing a clearer picture of the company’s inherent risk.
Conclusion
The beta coefficient is a powerful metric that offers investors a lens through which they can anticipate a stock’s price movements relative to broader market trends, thereby informing crucial risk management strategies. However, it’s paramount to recognise that it should not be viewed as a standalone decision-making tool. Rather, it serves as one piece of a giant puzzle in investment analysis. Beta should be complemented by various analytical approaches, including fundamental and technical methodologies, to paint a complete picture of an asset’s risk-reward profile.


