What is Exponential Moving Average (EMA)?

Making correct investment decisions requires robust fundamental and technical analysis skills to understand market events and price action. Most experienced investors use a combination of indicators to generate signals that trigger their buy and sell orders.
The moving average is a popular indicator to use for trading. Today, we will discuss one of its most useful variations, the Exponential Moving Average (EMA).
EMA is well-suited for short-term trading strategies but less useful for position trading. You can use EMA to predict future price movements. Let’s dive deeper into this indicator and how you can use it.
Key Takeaways
- EMA uses recent price data to more effectively highlight trend changes.
- EMA can be set for short intervals like 10 or 20 days for daily trading or longer spans like 50 to 100 days for forecasting, though longer spans might lead to misleading signals.
- EMA reacts faster to recent price shifts than SMA, giving traders clearer insights into market trends.
What is The Exponential Moving Average (EMA)?
The exponential MA is one type of the famous moving average indicator, a popular tool for tracking market activities. The EMA indicator uses historical average price data with a smoothing method to focus on recent changes and underline trend changes.
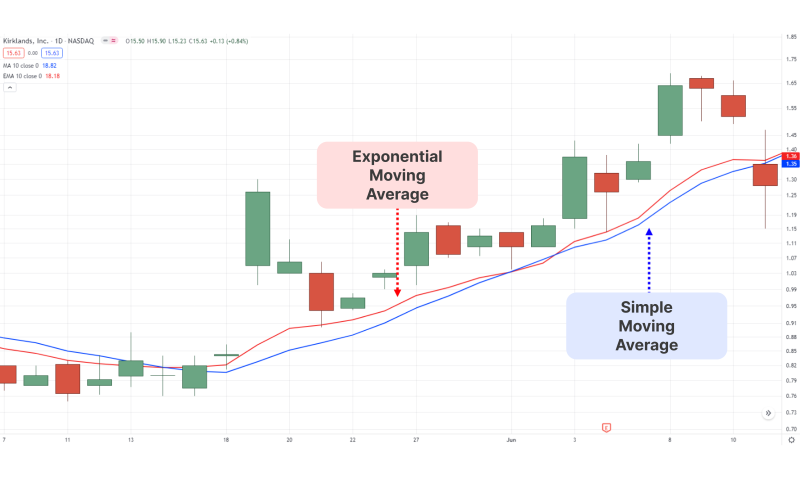
Unlike the Simple Moving Average (SMA), which assigns similar values to all price points, the EMA weighs recent activities more heavily to make it more valid for short-term trading.
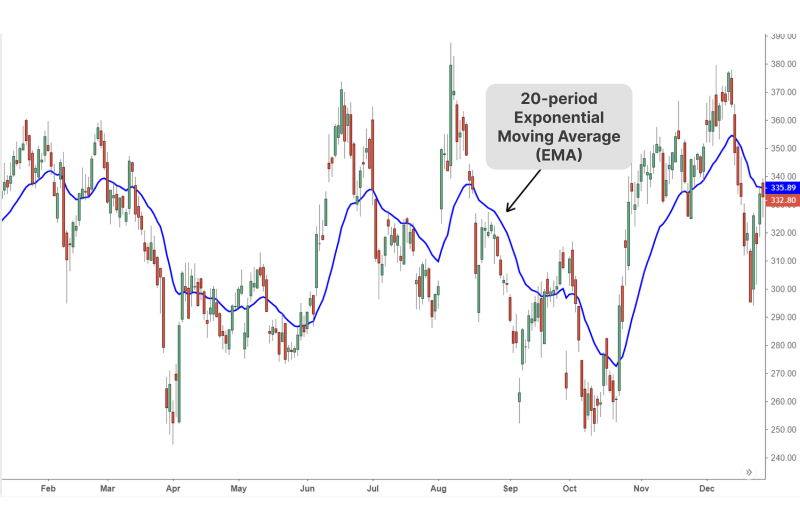
You can implement the exponential moving average indicator on a selected timeline, which will affect your analysis scope. For example, shorter timeframes, like 10 or 20-day EMAs, are used for intraday market positions.
Longer periods, such as 50- and 100-day EMA indicators, are suited for long-term predictions. However, this tool is less effective in this aspect because data points are smoothed out and can generate false signals.
You can draw multiple EMA lines from different periods to optimise your analysis by comparing the crossovers between both timelines and interaction with the market price.
Is EMA Better Than SMA?
The exponential MA is better than the simple MA due to its sensitivity to recent changes, providing accurate insights into current and potential trends. You can use its diversion from the price line to determine momentum strength and make your market entry.
This characteristic makes it ideal for scalping, intraday and swing-focused traders who actively open and close positions to capture volatile market opportunities.
It is a better tool for traders focusing on timely entries and exits, while SMA suits long-term investors because it ignores temporary fluctuations and provides a broader view of market trends.
How to Calculate Exponential Moving Average?
The exponential moving average calculation is straightforward, involving previous closing prices and a weight multiplier.
EMA=(Current Price−Previous EMA) × Multiplier+Previous EMA
The multiplier is a weighting factor that determines how much emphasis is placed on recent price movements compared to older values. It is calculated using the formula:
Multiplier = 2/Number of period + 1
Luckily, you do not need to calculate the exponential moving average formula manually. Trading platforms compute the value and depict the indicator’s line on the chart.
Explore Deeper Industry Insights
Learn from experts shaping the future of financial services — get the latest strategies and trends.
How to Use The EMA Indicator?
The exponential moving average (EMA) indicator is available on TradingView, MetaTrader, cTrader, and other leading platforms. Unlike custom chart patterns and indicators, EMA is free and does not require premium payment.
Apply the EMA on the chart by finding it on the indicators list, selecting the timeframe, and choosing the method of application that pertains to the price data for the specified period. You can choose daily closing, opening, highest, lowest or median values in the indicator.
The single or multiple EMA lines can be used for various purposes related to price prediction and making fact-based decisions.
Trend Identification
EMA is a powerful tool for identifying market trends by smoothing price data. Its time-weight approach helps evaluate and project price directions. Short EMA periods, such as 9-day or 20-day periods, can be used to analyse short-term movements.
Alternatively, you can use the 50-day or 200-day EMA to understand long-term market directions. The depicted EMA slopes gauge trend strength; a steep slope signals strong momentum. However, past prices are prone to smoothing out, increasing the possibility of false signals.
Entry and Exit Points
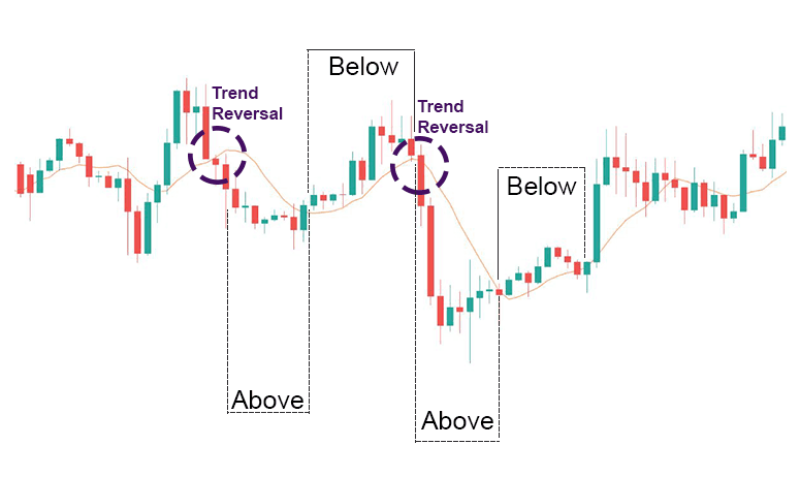
You can use EMA to optimise your market entry and exit by observing price crossovers. When the price crosses above the EMA, it generates a buy signal, suggesting bullish momentum.
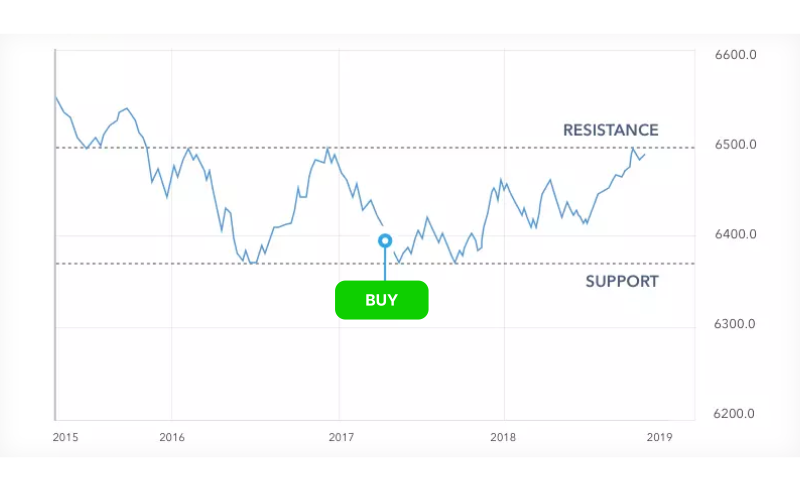
Conversely, a price crossing below the EMA signals a potential sell opportunity. Moreover, the EMA acts as dynamic support or resistance in trending markets, guiding stop-loss placements or profit-taking levels.
Combining the indicator with other technical tools, such as RSI or Bollinger Bands, strengthens signal reliability, ensuring better decision-making and trend confirmation.
Crossovers
You can use multiple exponential moving averages and evaluate the crossover between the lines and in comparison to the market price.
Ideally, you can depict two lines of short (10-day) and long periods (50-day) and find the intersection points and direction of each indicator as follows:
- When the short-term EMA crosses above the long-term MA, it signals a potential upward trend. also called the “Golden Cross”.
- When the short-term EMA crosses below the long-term MA, it signals a potential downward trend, also called the “Death Cross”.
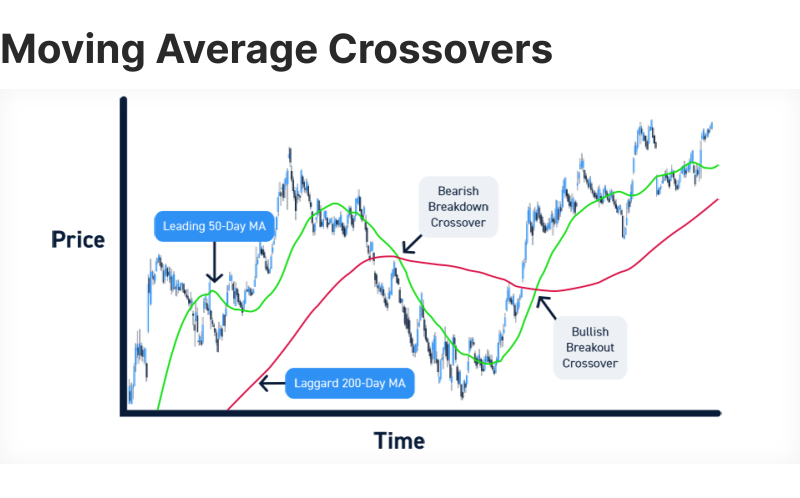
These crossovers are popular among traders for identifying trend reversals or confirmations. By combining crossovers with additional indicators like MACD, traders can strengthen the validity of signals, minimising the risk of false entries or exits.
Short-Term Trading Strategies
The exponential MA is well-suited for short-term trading due to its date-price sensitivity, assigning more weight to recent price data to capture trends quickly and more accurately.
Scalping
Scalpers actively trade in very limited windows. Therefore, periods of less than 10 days, such as 5—and 9-day periods, are better for identifying buy/sell signals and monitoring price movements relative to high-frequency markets.
Day Trading
With your day trading strategy, you can use medium timelines, like 10- and 20-period EMAs, to capture intraday trends. Focus on price crossovers or slope changes to time entries and exits within the same trading session.
Swing Trading
Executing orders on both sides of the market requires slightly longer periods to capture and confirm a trend direction. Use mid-range EMAs (20-day or 50-day) to identify short-term trends over a few days and process your order after the trend builds momentum.
Long-Term Trading Strategies
Despite its focus on momentary changes and short-sighted focus, it can be used for long-term strategies.
Position Trading
Buying and holding a position can be optimised with longer EMAs (50 and 200 days) to track more significant market changes. You can execute orders in the direction of the prevailing trend and hold the position for weeks or months.
Trend Following
Long-term timeframes can be used as a trend filter to execute buy or sell orders according to market momentum. Enter long trades when the price is above the EMA and short trades when below, focusing on long-term consistency.
Benefits and Drawbacks
The EMA is one of the most used moving averages due to its flexibility and responsiveness, which are crucial to capturing and confirming trends. However, there are some limitations that you must consider.
Discover the Tools That Power 500+ Brokerages
Explore our complete ecosystem — from liquidity to CRM to trading infrastructure.
Advantages
- Price sensitivity: EMA reacts quickly to recent movements, making it ideal for identifying trends in volatile markets.
- Ideal for short-term trading: Its responsiveness provides timely signals for scalping and day trading styles.
- Dynamic support and resistance levels: EMA acts as a flexible leveller to optimise order execution and adjust loss limits.
- Effective with other indicators: EMA combines well with RSI, MACD, or Bollinger Bands to improve price reading and prediction.
- Adaptable timeframes: Useful across short-term and long-term analysis based on chosen periods and trader’s approach.
Disadvantages
- Prone to false signals: Its sensitivity to recent data points can generate misleading signals in unstable markets.
- Unreliable for long-term trends: EMA may overreact to minor price changes, creating noise and incorrect trading signals.
- Requires additional confirmation: The exponential MA is best used with other indicators to reduce risks of misinterpretation.
- Lagging indicator: EMA responds to market changes after they are done and behind real-time price action, leading to potentially delaying entries/exits.
Technical Indicators to Combine with EMA
Combining the exponential MA with other indicators can improve price analysis and trend prediction. Coupling it with other technical tools helps increase the chances of success and minimises false signals.
Bollinger Bands
The Bollinger Bands track overbuying and overselling zones, where prices are more likely to change direction. Combining them with the EMA helps identify volatility and breakout potential.
When the price crosses the EMA and touches the upper or lower band, it often signals a strong trend continuation or reversal, especially in trending markets.
Relative Strength Index
RSI helps monitor market volatility. It can be used with the exponential MA to improve signals’ accuracy and reduce the likelihood of false entries in volatile markets.
It generates a reliable buy signal when the price crosses above the EMA, signalling bullish momentum, and a sell signal when the price drops below the EMA, indicating bearish pressure.
Conclusion
The exponential moving average is a dynamic technical tool that offers insights into trends, momentum, and market direction.
Its responsiveness to time and price fluctuations makes it ideal for short-term trading, while longer periods guide long-term strategies. Combining EMA with other indicators, such as RSI or Bollinger bands, can improve signal reliability and optimise market entry or exit.


