MACD Indicator – How to Read the Chart?

Today’s world is full of uncertainties, and what lies on the surface is often deceptive. A similar principle applies to trading. A trend that seems strong may, in fact, be weak and ready to reverse.
There are indicators that allow you to measure the intrinsic strength of a trend. Sometimes they confirm an uptrend and tell you to hold or increase your position. Sometimes they signal that the trend is suspicious, telling you that it is better to exit a position, take a profit, or maybe even change the strategy from bullish to bearish or vice versa.
Often traders use some methods of technical analysis relative to the results obtained by other technical methods. This is what Gerald Appel, a famous American trader, did. He took a simple deviation chart, or in other words, the oscillator, which reflects the distance between two moving averages, and applied to it the moving average of the obtained result. This method is called Convergence-Divergence Moving Average (abbreviated as MACD or MAC-D).
This article will explain what the MACD indicator is and how it works. In addition, you will learn about this indicator’s features, advantages, and disadvantages. In the end, we will look in detail at the indicator chart, its histogram, and the formula for its calculation.
What is a MACD Indicator And How Does It Work?
MACD is one of the best indicators created in the 20th century. It is almost forty years old, and the algorithm hasn’t changed during all that time. Moreover, entire strategies are based on this oscillator, and traders try to modernize it by adding new elements but without changing the main idea, which is to use this indicator as a trend predictor as well, not only for finding pivot points. All this makes the MACD indicator a truly universal analysis instrument and, perhaps, one of the most useful from the list of those usually included in the standard set of indicators of any trading terminal. Even if you do not have it for some reason, you can always find it on the Internet, with a wide variety of versions.
The MACD indicator belongs to the group of oscillators and occupies a separate window under the chart in the working area. It appears as a chart with vertical bars and a signal line. There are no overbought/oversold zones, as usual. The only horizontal reference point is the zero mark — the bars are plotted on either side of it, i.e., either up or down. And this is very convenient because it is enough to quickly get visually presented information about the market’s current state and assess events’ possible variants. Ease of use and versatility are the main advantages of this indicator.
Features of MACD Indicator
As practice shows, it is better to use the MACD indicator on periods from H1. In this regard, it is slightly more loyal than most classical technical analysis indicators. But with the increase of the period, the reliability of signals increases, so it has proved itself well on the 4-hour chart and above. Nevertheless, there are a lot of strategies that use it, even on the five-minute chart, so you should look at your trading system. If it is medium-term, you can work with MAСD on standard settings, but if it is intraday, you will have to experiment because there is some lag of signals inherent in the indicator.
The MACD indicator uses three moving averages. Originally it was presented as two movements with different periods. Still, later in the modernization, they were replaced by chart bars, showing the distinction between the moving average with a smaller period and the moving average with a larger one. This is much more convenient, and there is no confusion with the signal line, which is also an average on a period.
The following steps are taken to obtain the final picture. The chart value is formed by the slow movement subtracted from the fast exponential movement. Then this difference is smoothed out by way of another exponential moving average, which is the signal line (shown in the window as a red dotted line). This approach allows for the separation of false fluctuations and reduces the reaction to short-term volatility increases. Partially, it is because of the smoothing that it becomes possible to apply it on small periods. The entire algorithm can be called quite simple, but it does not affect its efficiency. On the contrary, the MACD indicator works better than many much more complex oscillators.
Advantages and Disadvantages of MACD Indicator
The undoubted advantage of this oscillator is that it can filter out many false signals given by the moving average, preserving all the benefits of such an excellent indicator as the moving average. Such a possibility is because it consists of МА of different orders. Being a trend indicator by its nature, it will constantly follow the current trend, excluding prolonged periods of giving false signals.
Excellent results are obtained using this oscillator in the context of its divergence from the price chart. The indicator divergence of the chart with the price chart almost always says, if not about the reversal of the current trend, then about its significant weakening (and probably correction).
Besides, it can be used as a filter indicating the direction of deals. If it is above the signal line, only long positions should be considered, and vice versa; at the current value of the histogram below the signal line, only short positions should be opened.
In addition to the above-mentioned obvious merits, underlying moving averages also present some disadvantages. The main drawback is its lag. MACD indicator often gives signals to buy or sell when the price has passed most of its way (however, this does not concern the signals produced by the divergence).
Also, it gives too many false signals on small timeframes, so it is better to use it on price charts with a period of at least one day. Besides, the more false signals it produces, the smaller the values of its parameters (periods of its constituent moving averages). On the other hand, increasing these parameters’ values may cause many good signals to be simply missed.
MACD Indicator: Chart, Histogram and Calculation Formula
MACD is an oscillator because it is displayed on a scale separate from the price chart. The moving average convergence/divergence chart itself consists of three main elements: the main line, signal line, and histogram. Let’s take a closer look at each of these elements to understand what role they play in the MACD indicator.
Main Line
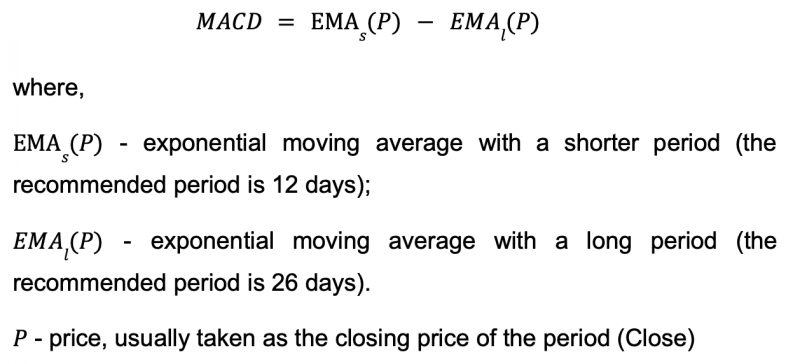
Three exponential moving averages with different periods are used for the calculation. A slow-moving average with a longer period (EMAl) is subtracted from the fast-moving average with a smaller period (EMAs). This is the main line of the indicator. The values of the main line are calculated using the formula below.

In a strong uptrend, the main line is above the zero level and is moving up. In this case, the short-moving average is higher than the long-moving average, and the divergence exists between them. In a strong downtrend, on the contrary, the main line is below the zero level and is moving down.
When the main line is above zero but changes direction from rising to falling, it means the moving averages are converging, which, in turn, may indicate a slowing of the uptrend or even its change. And vice versa, if the main line is below zero and changes its direction from downward to upward, it might mean that the downtrend is slowing down or that the uptrend has begun.
Signal Line
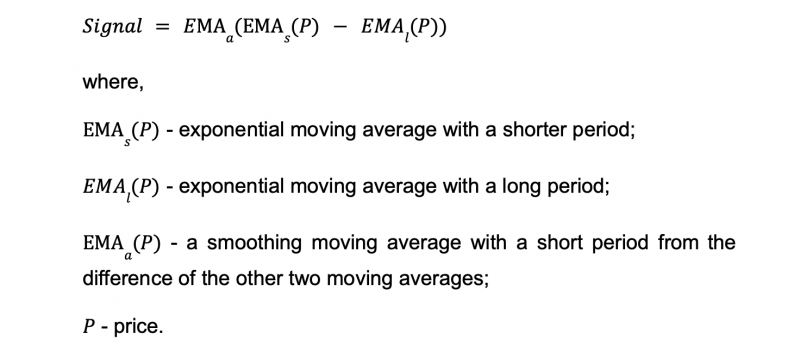
The MACD signal line is an exponential moving average of the main MACD line. Thus, when the main line crosses the signal line, it indicates a change in the trend of the main line. The values of the signal line are calculated according to the formula:

When the main line, being above the zero level, crosses the signal line from top to bottom, this is a clear signal for the possible start of a downtrend. Conversely, when the main line is below the zero level and crosses the signal line from the bottom up, this may mean the beginning of an uptrend.
It is important to note that by observing only the signal line crossing the main line, you can miss the resumption of the previous trend. For example, being below zero level, the main line has crossed the signal line from bottom to top and showed the beginning of an uptrend. But if the main line is late to cross the zero level and the uptrend changes into a downtrend again, then a backward crossover of the signal line can show the reversal of the trend with a very long delay.
Histogram
In the form of a histogram, i.e., a bar chart, the MACD chart shows the distinction between the main line and the signal line. The histogram chart is on the same scale as the main and signal lines. The beginnings of the histogram bars are located at the zero level, while the bars are plotted either upward or downward from the zero level, depending on the value.
Correspondingly, when the main line is above the signal line, the histogram is above the zero level, and when the main line is below the signal line, the histogram is below zero. It is clear that when the main line crosses the signal line, the histogram will surely cross the zero level.
Conclusion
The MACD Oscillator is an excellent tool for both experienced and novice traders. When working with the indicator, you should keep in mind that the larger the timeframe of the chart on which it is plotted, the fewer false signals there will be, but the more trading signals will be missed. So, look for the golden mean. And finally, like any other technical indicator for analysis, MACD requires confirmation. Do not make trading decisions based on the MACD alone; use other tools to assess the overall market situation too.
By clicking “Subscribe”, you agree to the Privacy Policy. The information you provide will not be disclosed or shared with others.
Our team will present the solution, demonstrate demo-cases, and provide a commercial offer


