What are the Bollinger Bands (BB) in Technical Analysis?

Technical analysis is essential for traders and investors, who use it to understand market trends and make informed decisions. They examine historical price and volume data to identify patterns that could indicate future market movements.
Among the key tools in technical analysis are indicators, which help interpret market data to predict changes and identify trading opportunities. The Bollinger Bands (BB), developed by John Bollinger, is a well-known indicator. It measures market volatility and provides insights into potential price directions.
Let’s explore Bollinger Bands in depth, including its structure, formula, strategies for using them effectively, and best practices for integrating them into market analysis.
Key Takeaways
- Bollinger Bands is a technical indicator that helps traders analyse price volatility.
- By plotting bands around a moving average, BB provides visual cues about whether a security’s price is relatively high or low.
- Bollinger Bands strategies focus on analysing how prices interact with the bands.
- BB should be used alongside other indicators like momentum oscillators or volume indicators to reduce the risk of false signals.
Bollinger Bands Explained
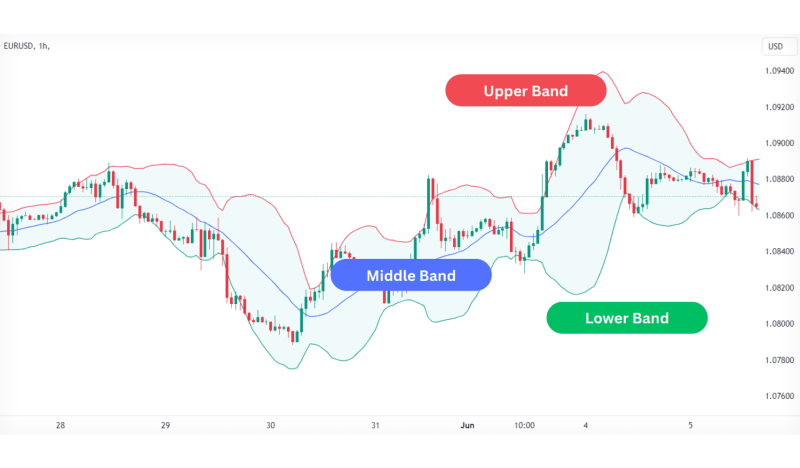
Bollinger Bands, created by the well-known technical analyst John Bollinger in the 1980s, have become a fundamental tool in financial markets. This sophisticated technical indicator helps traders understand price volatility and spot potential market trends.
By creating a statistical framework around price action, these bands offer insights into market conditions that traditional indicators might miss.
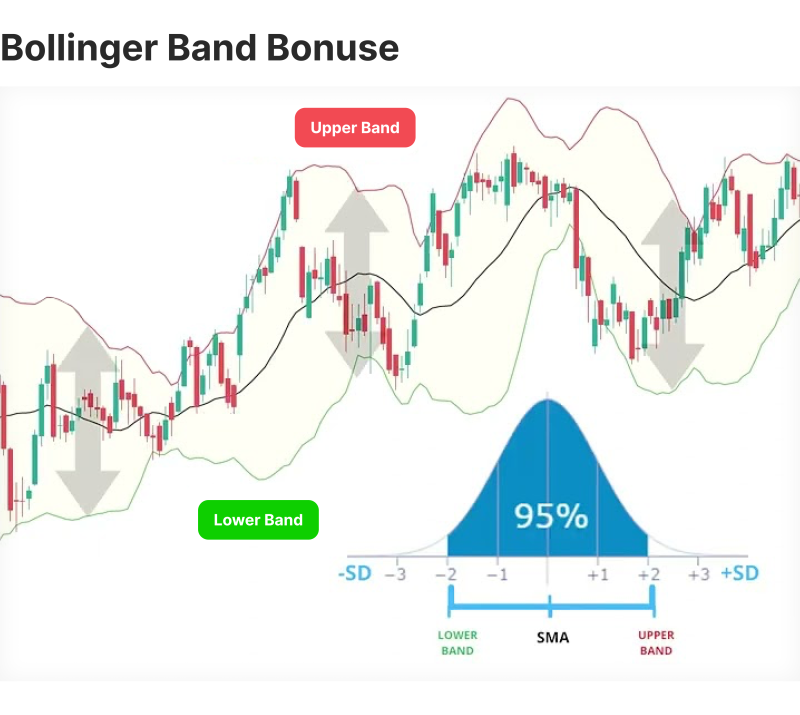
The indicator consists of three lines: a middle band (typically a simple moving average) and two outer bands that represent standard deviations from the middle line.
This unique construction allows traders to visualise price volatility and potential trend reversals with remarkable precision, making it an indispensable tool for both novice and experienced market participants.
Unlike static indicators, Bollinger Bands adapts to changing market conditions, expanding during high volatility and contracting during periods of low volatility.
This dynamic nature makes them particularly useful for identifying potential breakout points, overbought or oversold conditions, and generating strategic entry and exit signals across various financial markets.
Successful implementation of Bollinger Bands requires a nuanced understanding of their mechanics, complementary use with other technical indicators, and a robust risk management strategy.
Traders who master these bands can gain a significant edge in interpreting market movements and making more informed trading decisions.
Bollinger Bands Formula and Components
BB has three key components, each serving a distinct purpose in analysing market behaviour. Together, these components provide a dynamic framework for understanding price volatility and trends.
Middle Band (Middle Line)
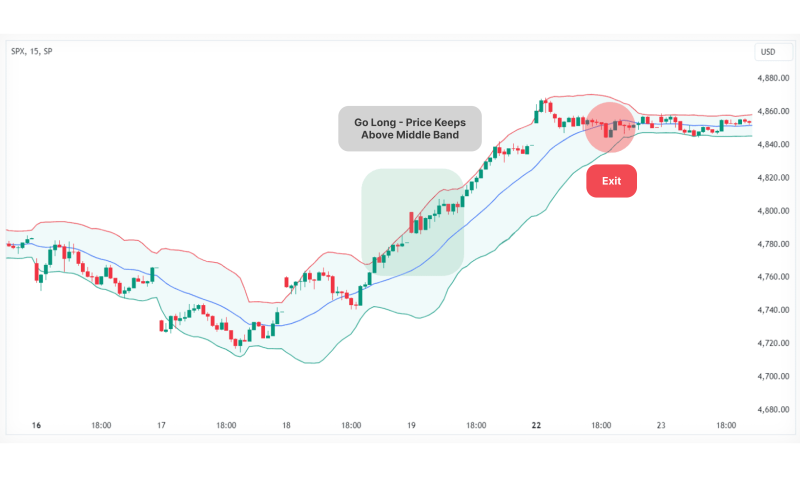
The Middle Band is a Simple Moving Average (SMA), typically calculated over a period of 20 days.
- Purpose: Acts as the baseline for the Bollinger Bands.
- Calculation: It represents the average price of an asset over the chosen time period, smoothing out fluctuations.
- Interpretation: The middle band helps traders understand the market’s overall trend.
Upper Bollinger Band
The Upper Band is positioned above the middle band and is usually set two standard deviations away.
- Purpose: Indicates the upper boundary of the price range.
- Calculation: Upper Band = SMA + (2 × Standard Deviation)
The standard deviation measures the asset’s price volatility over the same period.
- Interpretation: When prices approach or touch the upper band, it often suggests that the asset is overbought, signalling potential resistance or price correction.
Lower Bollinger Band
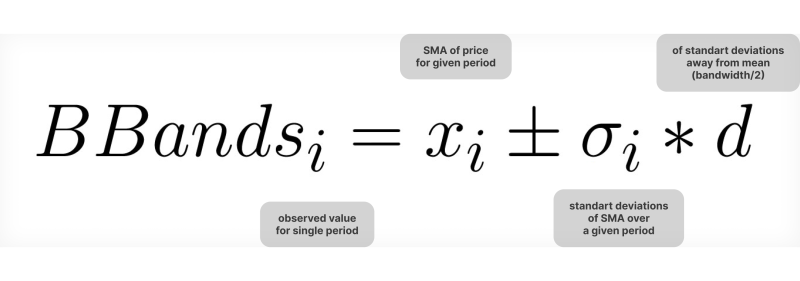
The lower band lies below the middle band and is set two standard deviations away.
- Purpose: Marks the lower boundary of the price range.
- Calculation: Lower Band = SMA – (2 × Standard Deviation)
- Interpretation: When prices approach or touch the lower band, it may indicate that the asset is oversold, signalling potential support or price recovery.
John Bollinger, a prominent technical analyst and market strategist, created the Bollinger Bands indicator to help traders better understand price movements and market volatility. With decades of experience in financial markets, Bollinger developed this tool to provide a more dynamic and responsive approach to technical analysis.
How to Use Bollinger Bands
The key concept behind BB is statistical distribution. The assumption is that most price movements tend to cluster around the average (middle band). The further the price deviates from the average, the higher the volatility.
Bollinger utilises two key customisable settings:
Explore Deeper Industry Insights
Learn from experts shaping the future of financial services — get the latest strategies and trends.
- Number of Periods: This determines the timeframe for calculating the middle band (moving average). The most common setting is 20 periods, but traders can adjust it based on their trading style and the asset’s volatility.
- Number of Standard Deviations: This controls the width of the bands. The standard deviation of 2 is widely used, but some traders experiment with different values depending on the desired level of sensitivity.
Remember, there’s no “one-size-fits-all” setting for BB. Finding the best settings for the Bollinger involves experimentation and backtesting based on your trading goals and the specific security you’re analysing.
Overbought and Oversold Signals
When the price touches or exceeds the upper band, it may indicate that the asset is overbought, suggesting potential resistance and a possible reversal or pullback.
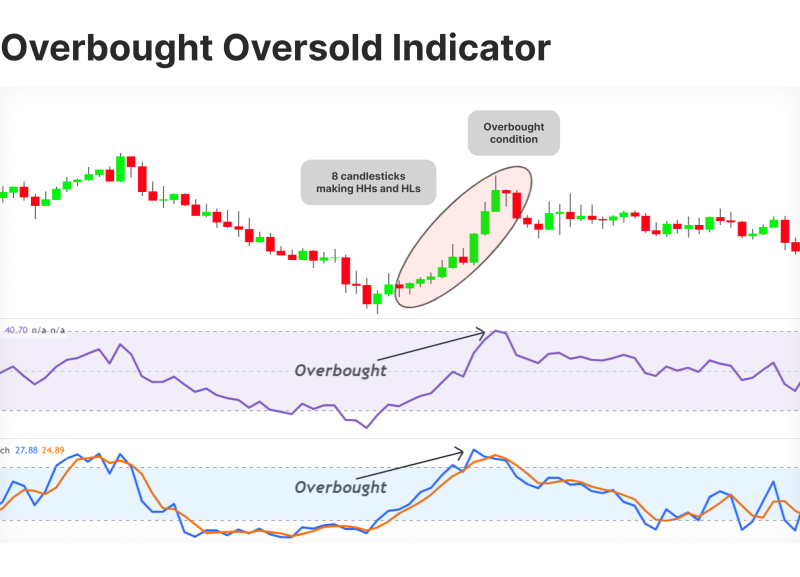
Conversely, when the price touches or falls below the lower band, it may indicate that the asset is oversold, suggesting potential support and a possible price increase.
Volatility Analysis
Bollinger Bands are exceptional at visualising market volatility through their dynamic width:
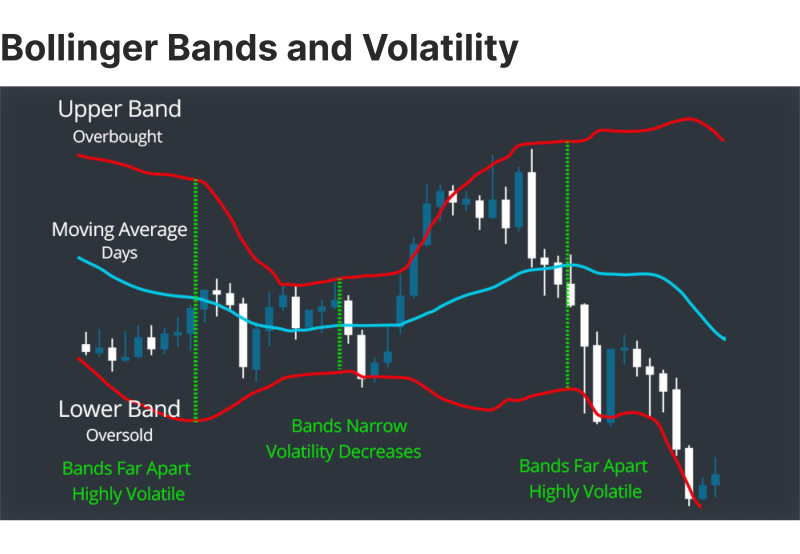
Widening Bands: When the bands expand, it reflects higher market volatility, often seen during strong trends or breakouts.
Narrowing Bands: When the bands contract, it indicates less volatility and often precedes significant price movements. This is known as the Bollinger Squeeze.
BB Patterns
Bollinger Bounce: This pattern occurs when the price “bounces” off the upper or lower bands and returns to the middle band. It works well in sideways markets, where price oscillates within a defined range.
Bollinger Squeeze: When the bands contract significantly, it signals a period of low volatility. A breakout is likely to follow, but the direction (upward or downward) cannot be predicted solely from the squeeze. Traders often use additional indicators like RSI or MACD for confirmation.
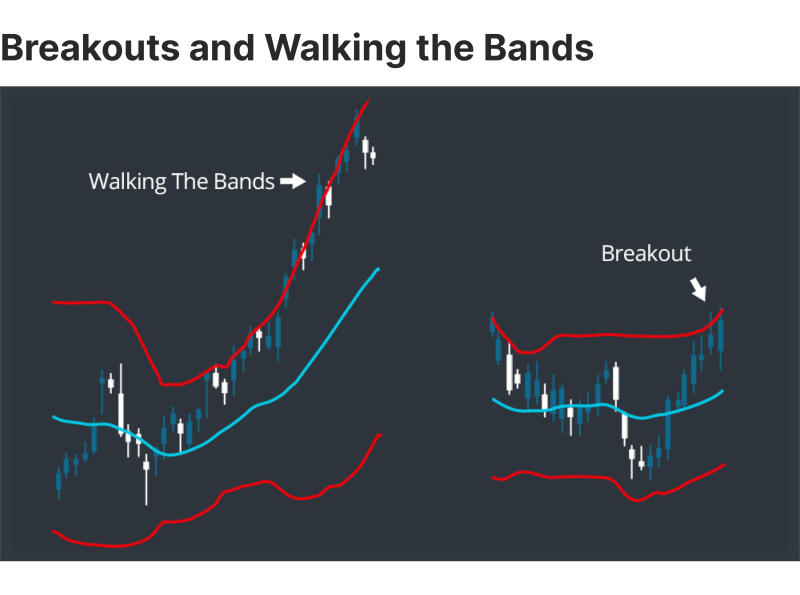
Breakouts: Price breaking above the upper band or below the lower band signals strong momentum. However, breakouts do not always predict the trend’s continuation; traders must consider other factors like volume and market context.
Bollinger Bands Strategy
Bollinger offers valuable insights for traders, enabling them to develop various strategies based on price interaction with the bands. Traders leverage it to optimise entry and exit points. Below are some of the most effective strategies:
Bollinger Bands Squeeze
The BB squeeze occurs when the upper and lower bands narrow significantly. It often precedes a breakout, where the price sharply moves in one direction, signalling increased volatility.
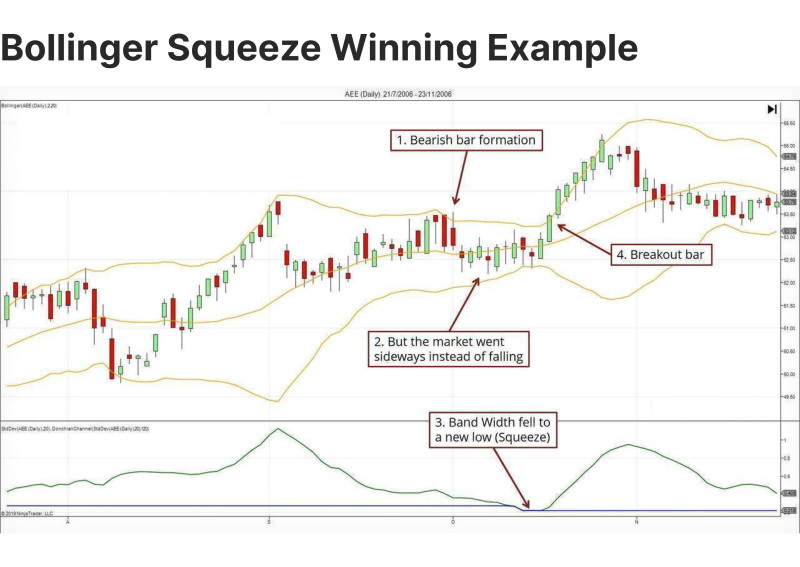
Trade Tip: Wait for a breakout confirmation before entering a trade.
Using Price Targets for Signals
When the price touches or breaches the upper Bollinger Band, it might indicate overbought conditions, suggesting a potential price pullback. Conversely, price touching or falling below the lower band could signal oversold conditions, hinting at a possible price reversal.
Price breakouts above the upper Bollinger Band are generally interpreted as bullish signals, while breakouts below the lower band are seen as bearish signals. However, it’s crucial to consider other technical indicators and market context for confirmation.
Trading with Bollinger Bands %B
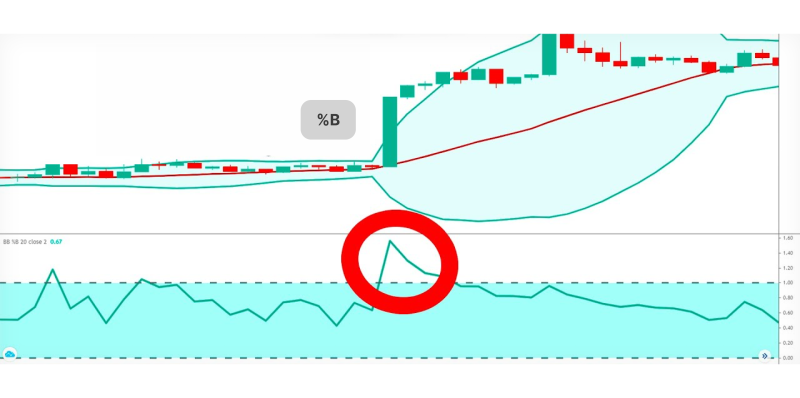
BB %B is an indicator derived from Bollinger Bands. %B quantifies a security’s price relative to the upper and lower Bollinger Band. There are six basic relationship levels: %B equals 1 when the price is at the upper band.
The %B indicator measures the price position within the bands as a percentage.
- Over 1: Price is above the upper band.
- Below 0: Price is below the lower band.
Combining with Other Indicators
Bollinger Bands can be combined with other technical indicators to enhance the accuracy of trading signals and reduce the risk of false signals. For more precise analysis, combine BB with:
- Moving Averages: Combining Bollinger with moving averages like the 50-day and 200-day moving averages can provide additional confirmation of trends and potential reversal points.
- Relative Strength Index (RSI): RSI helps identify overbought and oversold conditions, which can be used to confirm signals from Bollinger Bands.
- Volume Indicators: Volume indicators like the Volume Oscillator or On-Balance-Volume (OBV) can help assess the strength of price movements and confirm potential breakouts or breakdowns.
- Momentum Oscillators: These will help identify overbought/oversold conditions.
- Average True Range (ATR): This can be helpful in assessing trend strength.
Using Bollinger Bands in Trading Strategies
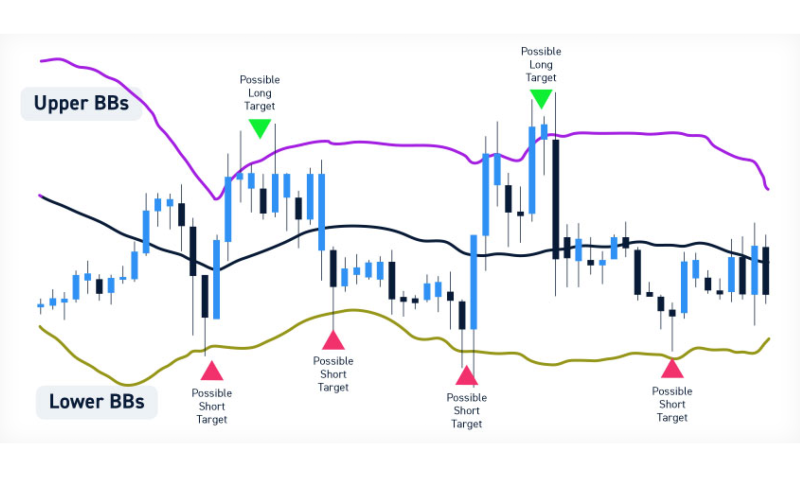
Bollinger can be incorporated into various trading strategies, both standalone and in conjunction with other technical indicators. Here are some popular approaches:
Momentum Trading: When the price moves above the upper band, it might signal a strong uptrend. Conversely, a break below the lower band could indicate a potential downtrend.
Mean Reversion: When the price touches the upper band, it might be overbought and due for a pullback towards the middle band. Similarly, when the price touches the lower band, it might be oversold and due for a rebound.
Volatility Trading: By monitoring the width of the bands, traders can identify periods of high and low volatility. This information can be helpful in making informed trading decisions.
Advantages of Using BB
Bollinger Bands offer traders several key advantages in market analysis. First, they provide a dynamic way to measure market volatility, automatically adjusting to changing price conditions by expanding and contracting around a moving average.
This flexibility allows traders to identify potential price breakouts and trend changes more accurately than fixed indicators. The bands help investors spot overbought or oversold conditions, giving clear visual signals about potential market reversals.
Another significant advantage is their versatility. Bollinger Bands work effectively across different financial markets, including stocks, forex, commodities, and cryptocurrencies. They help traders manage risk by providing clear visual cues about the intensity of price movement and potential price ranges.
The indicators also combine multiple pieces of information in one view, showing price trends, volatility levels, and potential momentum shifts simultaneously. Unlike many static indicators, Bollinger Bands adapt to market conditions, making them particularly useful for traders who need a responsive tool for making quick investment decisions.
Their ability to highlight potential price extremes and provide insights into market volatility makes them a robust and reliable technical analysis tool for both short-term and long-term investors. Furthermore, by identifying potential reversal points, BB supports effective risk management.
Limitations of BB
While Bollinger Bands are a versatile and widely used technical indicator, they have certain limitations that traders should be aware of to avoid misinterpretation or overreliance.
False Signals
BB can sometimes generate false signals, especially in ranging or choppy markets where prices frequently touch the upper and lower bands without clear trends. For example, touching the upper band does not guarantee an overbought condition, and stock prices can continue rising, leading to premature selling.
Discover the Tools That Power 500+ Brokerages
Explore our complete ecosystem — from liquidity to CRM to trading infrastructure.
No Predictive Power
Bollinger Bands are a lagging indicator, as they rely on historical price data. They reflect past market behaviour and do not predict future price movements. For instance, a Bollinger Squeeze indicates an impending breakout but provides no clue about the breakout’s direction.
Dependency on Settings
The default settings (20 periods and 2 standard deviations) may not suit all trading instruments or timeframes. Using inappropriate settings can lead to misleading interpretations, such as overly wide bands on low-volatility assets or narrow bands in highly volatile markets.
Ineffectiveness in Strong Trends
During strong bullish or bearish trends, prices often “walk the band,” meaning they stay close to the upper or lower bands for extended periods. In such cases, BB fails to provide reliable overbought or oversold signals, making trend-following strategies more effective.
Limited Context
Bollinger Bands focus solely on price and volatility, ignoring other market factors such as volume, news events, or macroeconomic data. Relying only on BB without considering additional indicators or analysis tools can lead to incomplete assessments.
Tips for Effective Use of BB
To mitigate the abovementioned issues, traders should use BB with complementary indicators and practice cautious market analysis.
Never forget that common BB settings are not a must. While the standard is 20-period SMA with 2 standard deviations, traders can customise them based on specific assets and trading styles. Typical recommendations to try are:
- Period Length: 10-50 periods
- Standard Deviation: 1.8-2.2
To manage risks:
- Never rely solely on BB
- Combine with other technical indicators
- Use stop-loss orders
- Consider the overall market context
Conclusion
Bollinger Bands are like a helpful roadmap for traders, showing them potential paths through the twists and turns of market movements. Think of them as friends who help you understand how prices might change and where opportunities could pop up.
But here’s the key takeaway: these bands aren’t magical crystal balls. They’re just one tool in a trader’s toolkit. Smart traders never rely on a single strategy. Instead, they combine Bollinger Bands with other methods and always have a solid plan to manage risks.
The real secret is practice and learning. The more you understand how Bollinger Bands work and how they reflect market behaviour, the better you’ll become at spotting good trading moments.
Remember, successful trading isn’t about finding a perfect indicator. It’s about building a thoughtful approach, staying disciplined, and continuously improving your skills. Bollinger Bands can be a helpful companion on that journey, but they’re just one piece of the bigger financial puzzle.
FAQ
Bollinger band's best settings?
No one-size-fits-all here! Your trading style is the key:
- For quick, lightning-fast scalping trades: Use a 10-period moving average with a 1.5 standard deviation
- For day trading: A 20-period moving average with a 2 standard deviation works well
- Pro tip: Experiment and find what suits your trading strategy
How Do You Actually Read Bollinger Bands?
Here’s the simple breakdown:
- Use the lower and upper bands as your price targets
- The upper band becomes your price target if the price bounces off the lower band and crosses the middle line (20-day average).
- Watch how prices move in relation to these bands
What's the Best Time Frame for Bollinger Bands?
A trader looking at long-term moves in an instrument’s price may prefer to set up BB on a monthly chart. In contrast, a short-term day trader may prefer to set up Bollinger on a five-minute chart. In reality, there is no single best timeframe.
Is Bollinger a Good Indicator?
The BB indicator helps understand various market signals. By analysing how prices interact with the upper, middle, and lower bands, traders can assess volatility, identify potential reversals, and spot breakout opportunities.
What do Bollinger Bands Actually Tell You?
They help you spot sudden price movements, reveal potential entry and exit points in the market, and act like a visual roadmap showing price volatility.


