How VWAP Indicator Can Help You Better Analyse Price Trends
Articles

Modern trading practices have become much more accessible with analytics tools, automated trading bots, live price updates and multi-functional platforms that facilitate instant trades.
However, an increased influx of retail traders and expanding market activities have raised the bar of competitiveness across different investing markets.
So, accessing markets like forex and crypto is easier than ever before, but becoming a successful trader takes time, effort and a deep understanding of technical indicators that simplify market analysis.
The volume-weighted average price (VWAP) is an essential trading indicator, renowned as a mandatory tool for anyone who engages in intraday trading.
This article will discuss the role of the VWAP indicator in correctly assessing market sentiment and reliably predicting future price movements.
Key Takeaways
- The volume-weighted average price (VWAP) is a metric that combines price action with asset’s trading volumes.
- VWAP allows traders to identify undervalued or overvalued tradable assets within high liquidity zones.
- VWAP is a short-term metric, only providing information about a single intraday trading period.
- The most popular VWAP strategy is coupling this formula with Bollinger bands and identifying support or resistance levels.
VWAP (Volume Weighted Average Price) Indicator Explained
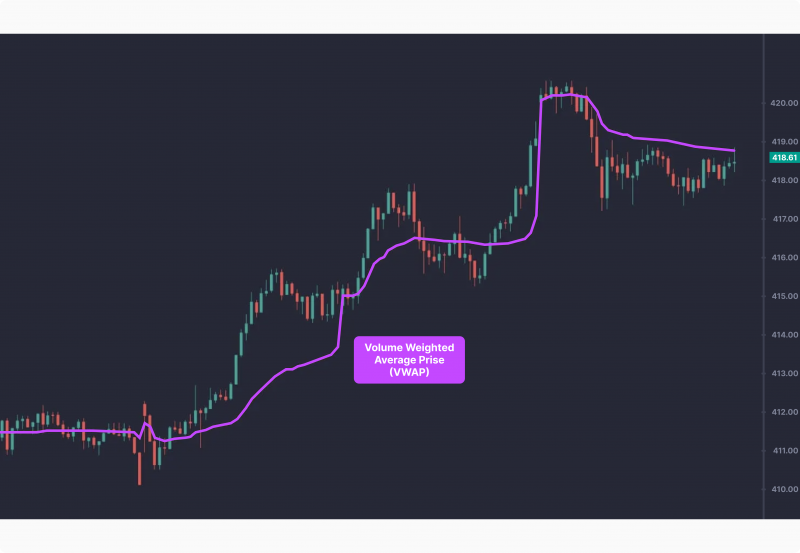
The VWAP indicator occupies a special place in the toolbox of experienced traders. This metric allows investors to understand the price action within an intraday trading session swiftly.
Using the average price paid for a given asset and its corresponding volumes, the VWAP indicator can paint an accurate picture of whether the asset is overbought or oversold.
VWAP indicator combines the price and volume data, creating a more contextual metric that incorporates an increase or decrease in trading activities. As a result, traders can use the VWAP indicator to identify high liquidity zones and profitable opportunities to sell or purchase tradable assets.
VWAP vs. Price-Oriented Trade Indicators
Most of the other technical indicators are focused on the price metric, analysing the price movements with various formulas. Depending on such formulas in a vacuum is problematic because the price movement doesn’t incorporate volumes.
So, it is impossible to gauge the price-volume relationship and determine whether the asset is liquid enough to be purchased or sold within a specific timeframe.
For example, while the VWAP and simple moving average metrics are similar, the SMA indicator only analyses the price patterns. Suppose the SMA shows a deviation from the average prices. In this case, it would be profitable to acquire a long or a short position.
However, the SMA metric doesn’t consider volumes, which could mislead investors into believing that price action is significant in the current market. This might not always be the case since prices could change due to the lack of liquidity, resulting in unfavourable trade deals.
How to Calculate VWAP
The VWAP calculation is relatively straightforward, requiring the price data of a tradable asset and corresponding volume levels. The price data calculates an intraday trading pattern’s average price (typical price), taking the highest, lowest and closing prices and deriving an average price number.
The respective trading volume then weighs the calculated average, the most significant point of distinction for the VWAP metric. As a result, users can gauge the price action and understand if the price movements are supported by an elevated trading activity related to the tradable asset.
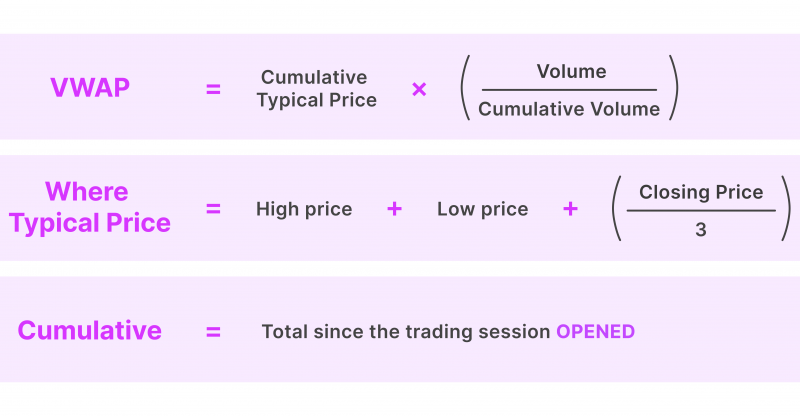
While the VWAP metric can be automatically calculated on most major trading platforms and data sites, it is straightforward to calculate it by hand. However, updating the VWAP metric every several minutes is necessary, as the changing volume drastically affects the final indicator.
So, it is still advisable to depend on automatic calculations, eliminating the chance of human error. As an exchange platform or a broker agency, it is recommended to have a built-in VWAP calculation feature, allowing users to access and analyse this indicator swiftly.
VWAP Upper and Lower Bands
As described above, the VWAP line shows the average price weighted by the total volume at a given period. While the classic formula is simply a line following the price chart, traders often prefer to accompany the VWAP line with upper and lower bands.
The bands serve as calculated standard deviations of the VWAP metric, showing the corresponding visuals of support and resistance levels.
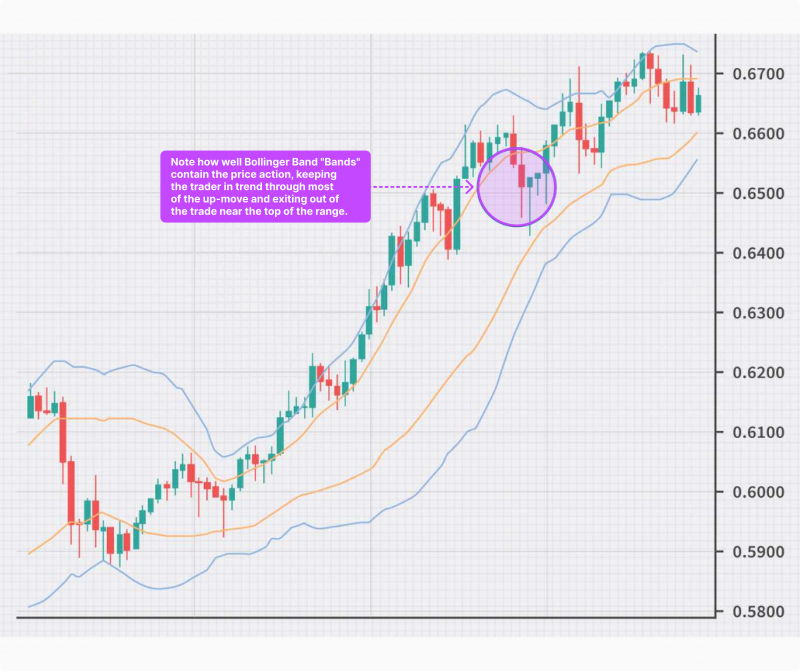
The upper and lower bands follow the price chart to signify the overbought and oversold levels of tradable assets. If the price spikes above the upper band, the asset is overbought and will likely enter a bearish trend soon after. The contrary is true for the lower band, signalling that the asset is oversold and will probably enter a bullish market.
VWAP indicator is often used by large financial institutions that wish to avoid making an adverse impact on trading markets after executing large trading deals.
VWAP Indicator as a Risk Management Tool
There are no objective answers on how to read VWAP indicators, as everything still depends on your specific goals and trading strategy. However, VWAP can be used to gauge the market at any given moment and get ready to execute your preferred investment strategies.
The support and resistance level analysis is the most valuable part of the VWAP analysis, as it showcases when the market is ready to sell or purchase a specific asset in high quantities.
As outlined above, not every price change signals an excellent investment opportunity, as the increased liquidity might not support the fluctuation. As a result, the asset might fluctuate due to volatility and not the increased market interest.
So, VWAP will often tell traders when to trade and when to avoid making hasty decisions. In this way, the VWAP formula acts as a very effective risk mitigation mechanism, letting investors avoid low liquidity zones and only trade when the market is sufficiently liquid for executing deals.
Popular VWAP trading strategies
While the most popular VWAP trading strategy is applying Bollinger bands to the equation, it is recommended to utilise moving averages and the relative strength index in conjunction with this metric.
If the VWAP results are similar to moving averages and RSI, traders are effectively double and triple-checking the validity of the VWAP metrics. As a result, the probability of skewed or misleading results is dramatically reduced.
The VWAP Bands Strategy with Market Trends
As described above, utilising Bollinger bands in combination with VWAP is a dominant strategy most professional traders use. Identifying support and resistance levels is one of the crucial tasks in trading, allowing investors to predict future price movements and decide between acquiring a long or short position.
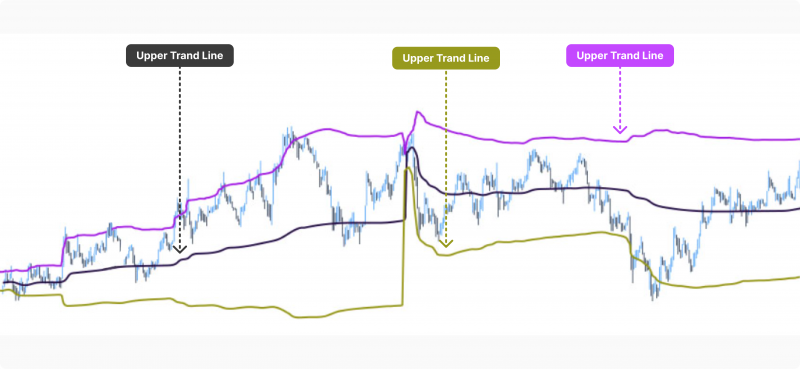
As a rule of thumb, upper bands signify resistance levels and signal an asset price decline. Conversely, lower bands indicate support levels and present an excellent opportunity to buy an asset.
However, the resistance and support levels might not be final, and an asset could further appreciate or devalue. The risk of misleading support and resistance levels is further elevated because VWAP is only used within a single intraday period.
So, traders should not depend on the VWAP bands analysis in a vacuum, as the short-term data used by the VWAP is simply too small sometimes.
Final Takeaways
The VWAP indicator has become a mandatory tool for traders across different markets. Identifying price action with liquidity zones is crucial and should always be considered before placing a trade order.
However, VWAP is a short-term metric and might not always provide a complete picture of the ongoing price trends. So, it is advisable to utilise the VWAP indicator mixed with other, more long-term metrics to avoid getting a skewed picture of the trading market.


