What Is a Simple Moving Average (SMA)?

Spotting reliable trends is essential for traders and investors in the financial markets. Research shows that strategies using moving averages have worked well over time, with success rates exceeding 70%. This makes the Simple Moving Average (SMA) a powerful tool for understanding market trends.
The SMA simplifies trading by smoothing out daily price fluctuations, offering a clearer picture of the market’s direction. Its straightforward calculation and proven effectiveness make it a favourite among beginners and seasoned traders.
In this article, we’ll examine the SMA, its operation, and how you can use it to make smarter trading decisions.
Key Takeaways
- SMA smooths out price fluctuations, providing an accurate picture of the market’s direction.
- SMA is ideal for long-term analysis, while EMA is more responsive to short-term market changes.
- Traders can use SMA to spot trends, find buy and sell signals with crossovers, or see reversal levels.
- Combining SMA with tools like RSI or MACD can make trading decisions more reliable.
What is SMA?
The Simple Moving Average is a practical method to calculate the average price of an asset over a given period. Unlike raw price charts that can appear erratic due to daily fluctuations, SMA smooths out the data, providing a clearer picture of the general trend.
For example, if you want to understand the average price of a stock over the last 50 days, you would calculate the SMA using the closing prices of those days. The result is a line that moves along with the price chart, reflecting the average price over time.
How Does SMA Work?
SMA works by adding together the prices of an asset over a defined time period and dividing the total by the number of time intervals. This straightforward calculation filters out short-term volatility, allowing traders to focus on the broader trend.
- Rising SMA: Suggests an upward trend, signalling that the market is generally moving higher.
- Declining SMA: Indicates a downward trend, reflecting a market moving lower.
Simple Moving Average Example

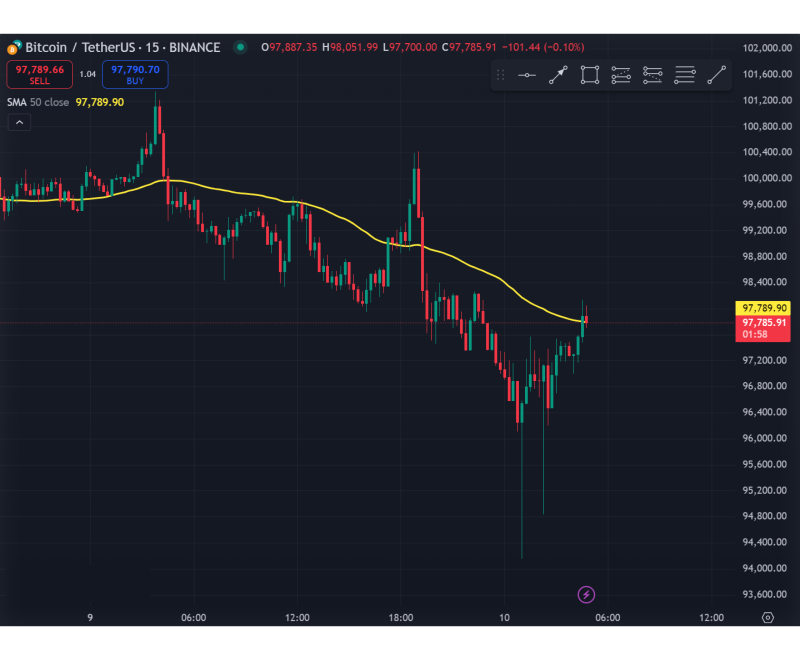
The chart above illustrates Bitcoin’s price movements (BTC/USDT) over a 15-minute timeframe. The yellow line represents the 50-period SMA, which smooths out price fluctuations over the past 50 candles to highlight the general trend.
The 50-SMA slopes downward for most of the chart, indicating a bearish trend (declining prices). However, toward the end, the price crosses above the SMA, hinting at a possible reversal or upward momentum.
Simple Moving Average Formula
The formula of SMA looks like this:

Where:
Explore Deeper Industry Insights
Learn from experts shaping the future of financial services — get the latest strategies and trends.
- P = Price of the asset at each time period
- n = Number of time periods
For instance, to calculate a 10-day SMA, you would add up the closing prices for the last 10 days and divide the total by 10.
How to Calculate Simple Moving Average
Let’s calculate a 5-day SMA for a stock:
- Collect the closing prices for the past 5 days. Let’s assume they are $50, $52, $51, $53, and $54.
- Add these prices together: 50+52+51+53+54=260.
- Divide the sum by the number of days (5): 260/5=52.
- The SMA for 5 days is $52.
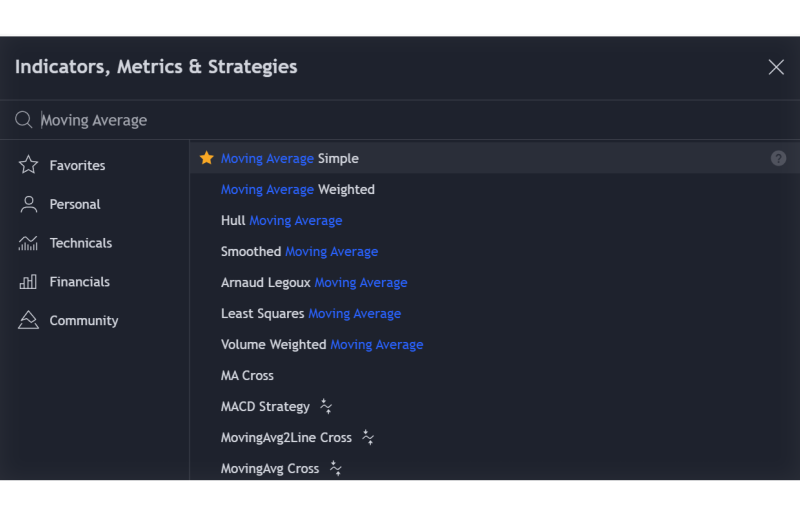
While the manual method is excellent for grasping the concept, most traders use SMA as an indicator to streamline the process. Platforms like TradingView, MetaTrader, or Thinkorswim automatically calculate and overlay SMA lines on price charts, enabling real-time analysis.

Simple vs Exponential Moving Average
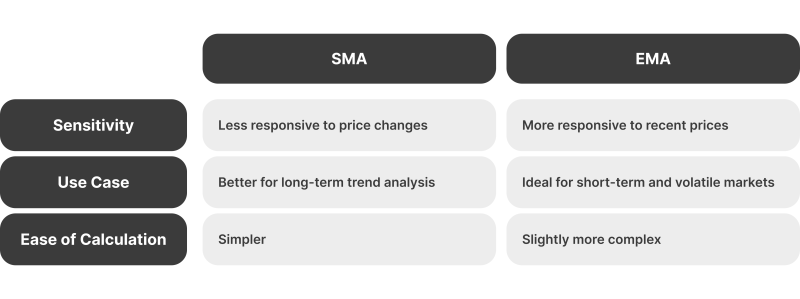
When looking at market trends, traders often choose between two popular tools: SMA and EMA (Exponential Moving Average). Both help smooth out price changes and highlight trends, but they work a little differently. These differences can make one better than the other, depending on what kind of trading you’re doing.
Simple Moving Average
SMA is calculated by taking the average price over a set time period. Each day in that period is treated equally, so every price has the same impact. This makes the SMA steady and reliable, especially for spotting long-term trends. Since it doesn’t react much to sudden price spikes, it’s good for focusing on the big picture without getting distracted by short-term ups and downs.
Exponential Moving Average
EMA, however, gives greater weight to recent prices than to older ones. Because of this, it reacts faster to market changes, which is helpful if you’re trading in fast-moving markets or making short-term decisions. But this sensitivity can also be a downside—it may lead to false signals if prices are jumping around unpredictably.

Which One Should You Use?
It depends on your trading style. SMA is a solid choice if you’re looking at the long-term picture and don’t want to get caught up in daily noise. On the other hand, if you’re focusing on quick trades and want to respond to market changes as they happen, EMA might be better.
Some traders use both together. For example, you might use an SMA to see the overall trend and an EMA to find good moments to buy or sell. Combining the two lets you get a clearer picture of the market and make more confident decisions.
Simple Moving Average Trading Strategy
SMA isn’t just a tool to observe trends—it’s a practical and versatile way to make financial decisions. Whether you’re trying to confirm market direction, determine the best time to buy or sell or identify necessary price levels, SMA can be a key part of your strategy.
Spotting Trends with SMA
One of the simplest ways to use SMA is to determine whether the market is going up, down, or staying flat. Traders can tell this by observing the direction of the SMA line and how the price moves around it.
- If the SMA is going up and prices are mostly above it, the market is in an uptrend (prices are rising).
- If the SMA is going down and prices are mostly below it, the market is in a downtrend (prices are falling).
For example, if you’re looking at a 50-day SMA and it’s moving steadily higher, it means the market is gaining strength. A downward-sloping SMA could mean the market is getting weaker.
Using Crossovers for Buy and Sell Signals
A popular SMA strategy involves using two SMA lines: one for the short term and one for the long term. When these lines cross, it can indicate a change in the trend.
- A golden cross occurs when the short-term line (like the 50-day moving average) moves above the long-term SMA (like the 200-day moving average). This is usually seen as a bullish signal, suggesting that it’s a good time to buy.
- A death cross happens when the short-term SMA moves below the long-term SMA, signalling a bearish trend and a possible time to sell.
For example, if the 50-day SMA crosses above the 200-day SMA on a stock chart, it might be a sign to start buying because the market is gaining strength.

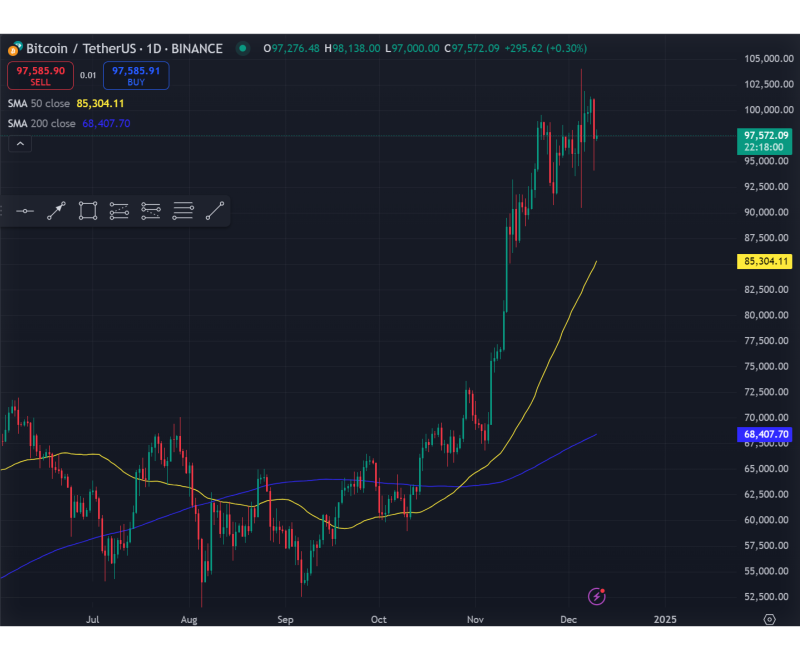
The chart above illustrates a crossover strategy using Bitcoin’s price on a daily timeframe. The 50-day SMA (yellow) crosses above the 200-day SMA (blue), forming a golden cross—a strong bullish signal.
Discover the Tools That Power 500+ Brokerages
Explore our complete ecosystem — from liquidity to CRM to trading infrastructure.
SMA as Support and Resistance
SMA lines can act as support or resistance, helping predict where prices might stop or reverse. In an uptrend, the SMA often acts as a support level, where the price bounces back up after touching it. It may act as resistance in a downtrend, where the price struggles to move above it.
For example, imagine a stock price rising but dipping back to its 20-day SMA before continuing upward. This could be a good time to buy, as the SMA serves as a guide for when the price is likely to reverse back up.
Combining SMA with Other Tools
SMA becomes even more powerful when used with other trading tools. For example, pairing it with the Relative Strength Index (RSI) can help confirm whether a security is overbought or oversold. Indicators like MACD or volume analysis provide insight into a trend’s strength or potential reversal.
Closing Thoughts
The Simple Moving Average helps you see trends, figure out where prices might go next, and make better decisions about when to buy or sell. The more you practice using SMA, the better you’ll understand how it works and how it fits into your trading style. Over time, it can become one of your go-to tools for making smarter, more confident trades.


