What is Weighted Moving Average (WMA)?

Succeeding in the financial market requires making the right decision at the right time and using the right tools. It may take years of trial and error to find the perfect system that suits you and fits your style. However, straight off the bat, we can say that the moving average is a popular tool that most participants use, especially its WMA variant.
The weighted moving average facilitates tracking trends using previous data. Using a line depicted on the chart, you can find price movements, predict sentiment, and understand volatility.
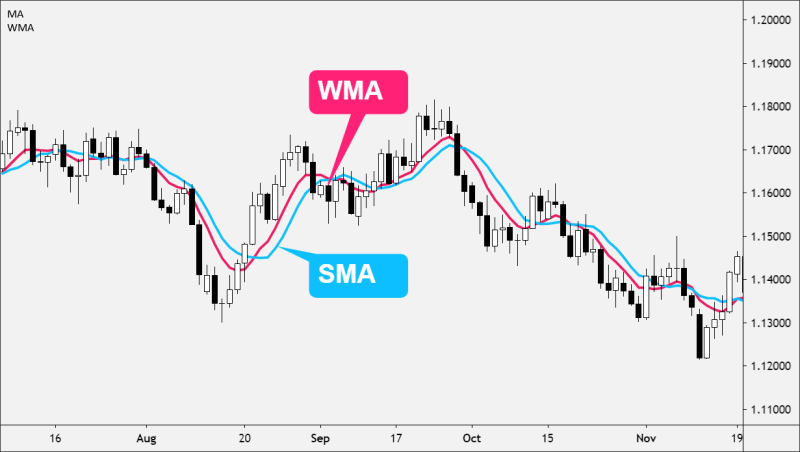
Traders usually compare the WMA indicator with SMA, EMA, and VWMA. However, the weighted approach provides a faster tracking tool.
Key Takeaways
- The weighted moving average is a trend-tracking technical indicator that helps analyse and predict market trends.
- The WMA calculates the historical average prices and assigns more weight to the most recent data points.
- Traders use multiple weighted MAs and analyse the interaction with the market price to time their entry/exit and make decisions.
Understanding The Weighted Moving Average
The weighted moving average (WMA) is a technical indicator that calculates the average of selected price data over a given timeframe. It assigns more weight to recent values and linearly decreases the impact of old data, responding faster to price changes.

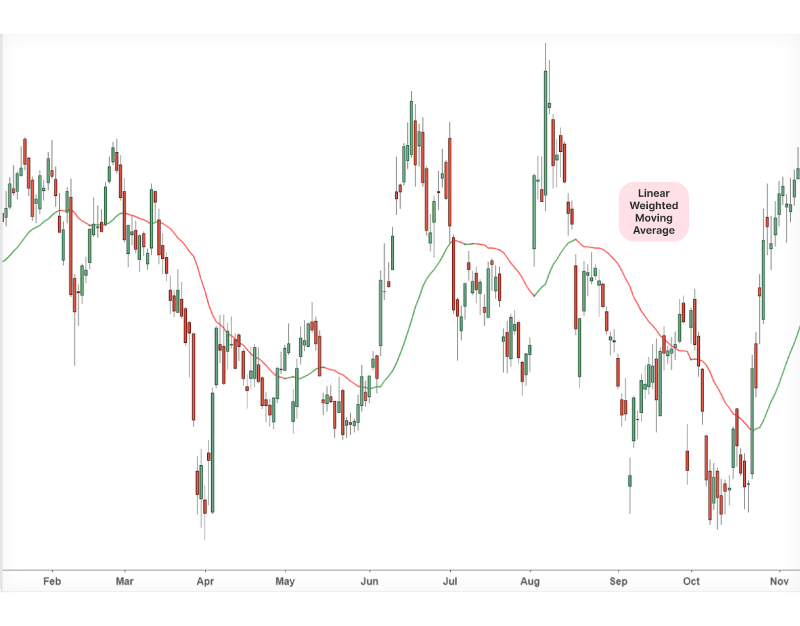
The chart depicts the WMA indicator with a line moving alongside the market value. Traders analyse the intersection points between WMA and the current price line to draw conclusions about current and future trends, support and resistance levels, and potential reversal zones.
Additionally, you can generate more than one line with different periods (short-term and long-term) to predict possible price changes and measure momentum strength. Using the 20-day WMA is popular for tracking short-term changes, while the 100-day line is common for long-term traders.
It is compared to the exponential and volume-weighted moving average in assigning higher values to recent prices. However, the WMA lags less than the EMA and provides better estimates than the VWMA.
Is The WMA Better Than SMA?
The simple moving average is straightforward, assigning similar significance to all data points in the selected period for a smoother and broader technical analysis. However, the WMA provides more accurate trend tracking for recent market changes thanks to its weight allocation.

The WMA indicator strategy works well with short-term market positions like scalping, swing trading and day trading, allowing traders to capitalise on moments of volatility through faster trend tracking.
On the other hand, the SMA suits position trading and is more reliable for locating long-term trends. However, its smoothing characteristic makes it better for stable markets as it reacts slower to sudden changes.
How to Calculate The Weighted Moving Average
The calculation is complex due to the weighting factor. You must select the desired time period, multiply each closing price by the corresponding day and divide by the total number of weighs.
WMA = ∑i=1n(Pi×Wi)/∑i=1nWi
A simpler weighted moving average formula is as follows:
WMA = Weighted Sum/Sum of Weights
As such, if we analyse price changes across five days:
Explore Deeper Industry Insights
Learn from experts shaping the future of financial services — get the latest strategies and trends.
Weighted Sum = (5 X day-5 price) + (4 X day-4 price) + …
Sum of Weights = 5 + 4 + 3 + 2 + 1 = 15
In this weighted moving average example, the oldest day is assigned the lowest value (1), while the most recent day is multiplied by (5).
Luckily, traders do not need to manually compute this number because it can be very challenging, especially when analysing 50 or 100 days. Therefore, trading platforms use a weighted moving average calculator to generate the value and draw the line on the chart.
How is The WMA indicator Used?
The weighted average indicator is dynamic, and traders can use it for multiple purposes and strategies. It responds much faster and more noticeably to sudden price changes, making it a useful tool to track markets and see the bigger picture. Here’s how you can use it.
Confirming Trends
The WMA is a versatile indicator for analysing market trends, putting greater emphasis on recent closing prices through a linear distribution. Short timeframes, like 10 days, are used to find short-term movements and trend directions, while 50 days and more extended periods are used to view broader market dynamics.

You can track the WMA direction to analyse trend strength, as steeper slopes refer to a more persistent momentum. However, it is worth noting that its sensitivity to recent price changes can lead to false signals.
Traders often observe the intersection points on the chart as follows:
- If the price line crosses above the WMA, it suggests an upward trend and a buy signal.
- If the price line crosses below the WMA, it suggests a downward trend and a sell signal.
Finding Entry and Exit Points
You can use the weighted MA to find market entry and exit points through crossovers. This helps optimise your order execution and avoid buying/selling at the wrong time, especially during volatile markets.
- When the price crosses above the WMA, it means a bullish trend.
- When the price crosses below the WMA, it means a bearish trend.
You can use this information to execute your long and short positions.

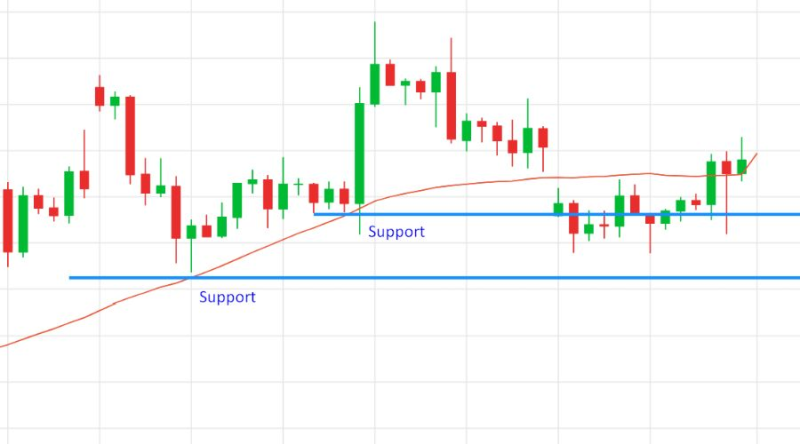
Additionally, you can use multiple lines to create dynamic zones of support and resistance, with shorter WMAs reflecting near-term levels and longer periods highlighting stronger trends. Price interactions with these lines help identify potential bounces, reversals, or breakouts.
Analyse Divergence Areas
Divergence happens when the price makes higher highs or lower lows, but the WMA does not follow suit. For example, if the price forms higher highs while the WMA trends downward or flattens, it signals bearish divergence, suggesting potential weakness.
Conversely, if the price forms lower lows while the WMA rises or stabilises, it indicates bullish divergence, hinting at a possible reversal.
Such key moments highlight discrepancies between price and trend strength, offering valuable insights, especially when used in conjunction with other indicators like RSI or volume analysis.
Measuring Volatility
You can measure market volatility by monitoring the indicator’s slope and its distance from the current market price. The steeper the slope is, the stronger the momentum and the higher the volatility. On the other hand, if the indicator line is flat, it refers to slow or choppy markets.
Another way to track volatility is by observing the gap between the price and WMA lines, where significant divergence means high volatility and vice versa.
Discover the Tools That Power 500+ Brokerages
Explore our complete ecosystem — from liquidity to CRM to trading infrastructure.
You can compare multiple WMAs with varying periods to further clarify volatility. When short-period WMAs diverge significantly from longer ones, it signals increased market activity. Combining observations with volatility-focused tools like Bollinger Bands provides more precise insights into market conditions and potential price fluctuations.
WMA Trading Strategies
The weighted MA is commonly used before executing market orders. Traders perform trend analyses using one or multiple WMAs, compare interactions with the market price, and monitor slope change to execute their preferred trading strategies.
Short-term Strategies
- Scalping: Use short timeframes like 5- or 9-day WMAs to find micro-trends. Enter long positions when the price consistently stays above the indicator and exit when it crosses below. You can also combine it with RSI to confirm overbought or oversold conditions and improve your decision-making process.
- Swing Trading: Pair a 20-day with a 50-day WMA. When the 20-day line crosses above the 50-day, it is a Buy signal, while if it crosses below, it generates a sell signal. This method captures intermediate price swings within a trending market.

Long-term Strategies
- Reversals: Combine a 50-day and 200-day WMA to identify trend reversals. When the 50-day line crosses above the 200-day line, it indicates a long-term bullish trend, known as the golden cross. When the 50-day WMA drops below 200-day, it suggests a bearish sentiment or a death cross.
- Position Trading: Apply a 200-day indicator to track long-term changes. Buy when the price remains above the 200-day WMA, confirming an uptrend, and sell when it stays below, indicating a downtrend. This works perfectly to track trends in stable markets.
Benefits and Limitations
The weighted moving average is a valuable technical tool to observe and predict trends. It might not be sufficient to make trading decisions, requiring other tools to improve the precision. Is WMA better than other indicators? What are its limits? Let’s explore its pros and cons.
Advantages
- The WMA reacts quickly to recent price movements, offering timely signals to enter/exit the market in a timely manner.
- The weighted MA helps validate trend direction and strength when used with other indicators or multiple WMA lines.
- WMAs adapt to price changes, highlighting support and resistance zones and influencing stop-loss and order-limit placements.
- It can be paired with other indicators like the RSI, MACD, or Bollinger Bands to improve reliability.
- Applicable to both short-term and long-term trading strategies.
Disadvantages
- Fluctuates significantly to noise in choppy markets, leading to false signal generation.
- The high sensitivity to recent price action may lead to overreaction in short-term volatility.
- WMAs struggle to provide clear signals during consolidation phases and low market activity.
- Requires confirmation with other tools because the WMA alone can be risky and send inaccurate signals.
Conclusion
The weighted moving average is a valuable technical indicator for tracking trends and predicting future movements based on recent price data.
It assigns higher weights to recent data points to improve short-term precision. However, unlike the exponential moving average, it does not smooth out older prices, responding strongly to sudden changes, making it hard to judge its usefulness.
However, combining it with other tools can improve its accuracy and allow you to track movements and make timely trading decisions.


