What is DMA in Stock Market?

DMA indicator is usually compared with other moving averages, such as EMA and SMA. Therefore, let’s explain DMA meaning in share market and how you can use it.
Trading in the financial markets is usually combined with study tools and indicators that help the investor make informed decisions.
Analysing market movements and price action has become much easier with the evolution of trading platforms, which offer a comprehensive toolkit for making wise investment decisions.
The displaced moving average is a standard indicator used to identify price trends, which is popular among stock traders due to its usefulness in determining support and resistance levels.
Key Takeaways
- DMA is a trend detection indicator that helps the trader find the current market price direction and movement.
- DMA is a variation of the moving averages, which can be adjusted forward or backwards from the current MA indicator.
- The full form of DMA is the displaced moving average, usually compared to the exponential moving average (EMA), which has similar used cases but emphasises recent data.
DMA Meaning and Importance
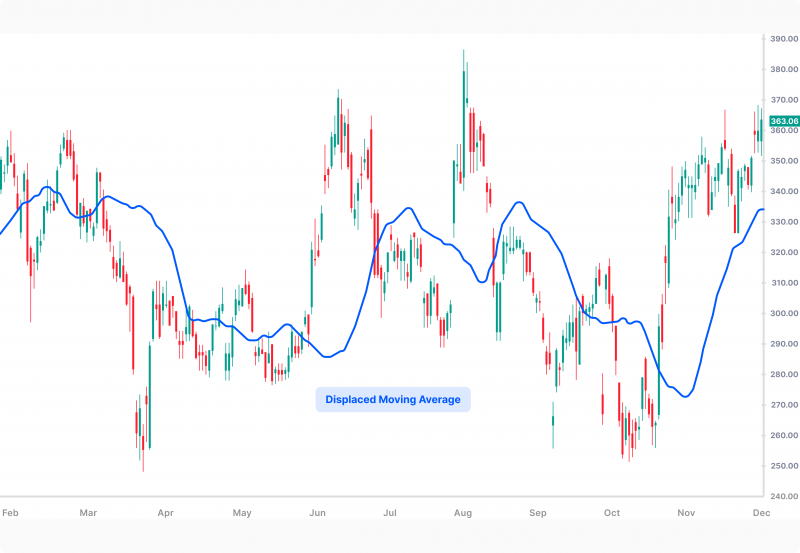
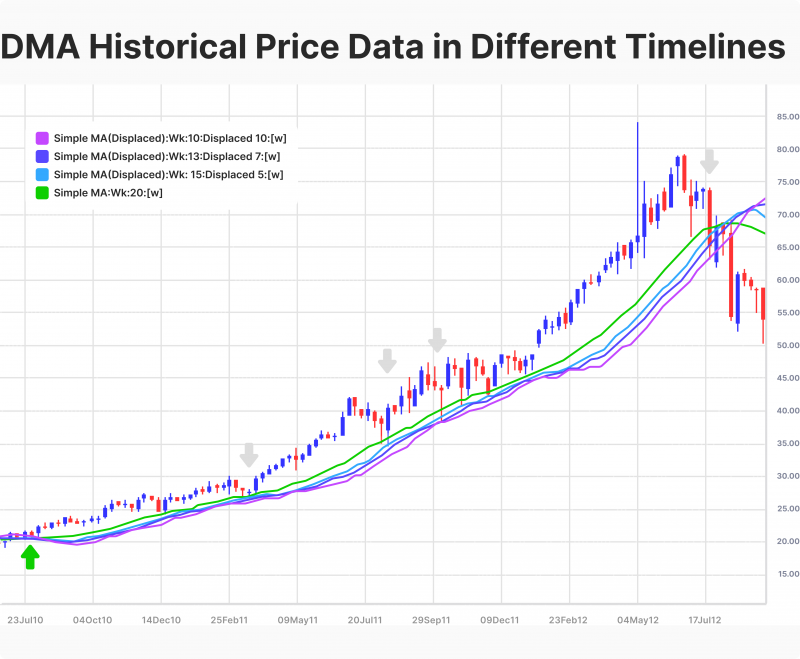
The displaced moving averages originated from the simple moving average. It is the same as the MA indicator but has been shifted backwards or forward to better predict trend possibilities in earlier or future timestamps.
DMA is used over different time periods to analyse price data by calculating a stock price moving average data and placing the indicator at different timelines to evaluate the potential trend direction.
Therefore, traders can identify prospective surges in shares with high expectations, allowing them to capitalise on unmissable gaining opportunities.
Thus, the displaced moving average indicator will send signals when it intercepts the price line. Each call will suggest/trigger a market order to buy or sell, depending on the crossover direction between the two lines.

What is DMA (Displaced Moving Average) in Stocks?
Trading stocks relies heavily on understanding price action and identifying trends before everybody capitalises on significant gains. The location of the DMA line in comparison to the price line will indicate the trader’s suggested activity.
If the price line is above the DMA line, it means an upward movement, suggesting the trader buys (going long).
However, a downward movement is present if the price line is under DMA, suggesting the trader sells (going short).
These decisions interchange every time the DMA and price line intercept. Note that they might cross each other between top and bottom multiple times, so you can wait for it to produce a powerful direction or trade on both sides of the trend.
How is The DMA Moving Average Used?
Some may argue that DMA is better than MA because it allows you to move it forward and backwards across different timelines, which is beneficial in two significant ways.

Trend Directions
Detecting a current trend movement is one of the biggest advantages of the displaced MA, providing the trader with an insight into the stock price direction.
If the market price is moving above the DMA, it indicates an uptrend, suggesting an opportunity to buy (long) and benefit from the increasing price to sell with more profits.
Conversely, if the market price is moving below the DMA, it indicates a downward trend, suggesting an opportunity to sell (short) and capitalise on the chance to earn some gains before the price dips more.
However, the price line does not move in a consistent manner, and it may fluctuate or move above and under the DMA multiple times.
In many instances, an investor may use the MA trend, and when the price line drops below the MA line, it might be determined that the trend is over and downward movement has started. However, this might not be a true reversal point.
In this case, a displaced moving average is better to uncover the real trend movement across different periods to find out the real trend start and endpoints.
Support and Resistance Levels
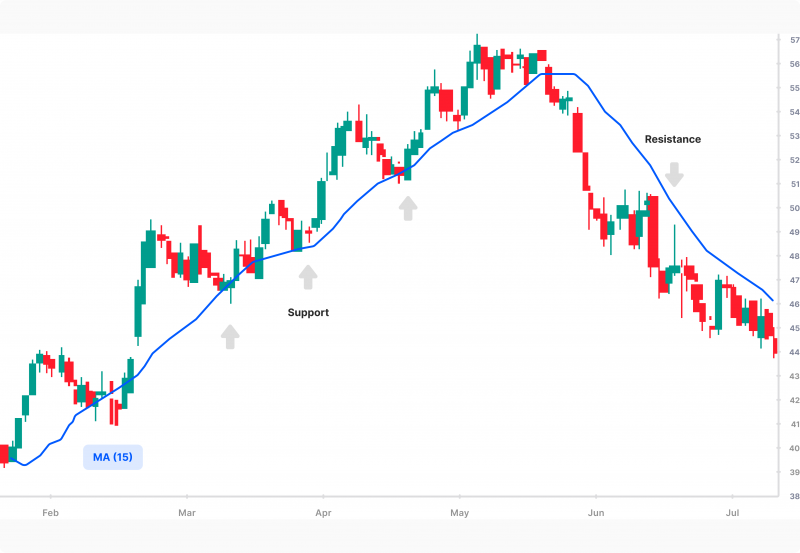
DMA in stock can be used as a support or resistance level, suggesting a point where upward or downward movements are starting, pointing to an opportunity to long or short stocks.
On the price chart, the displaced moving average line can be aligned with historical pullback data, drawing a line touching the approaching price trend. Thus, when both lines intercept, if the price line bounces back and falls from the DMA line, it suggests a falling trend and a sell order.
On the other hand, if the price line moves along the drawn DMA and starts ascending on top of it, it indicates a rising trend and a buy order.

DMA vs EMA
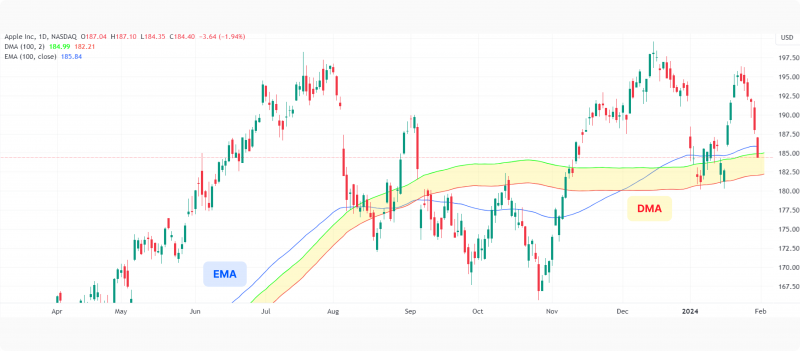
The displaced moving averages and exponential moving averages might look similar. In fact, both have similar use cases and are helpful in detecting trends and price directions in the stock market, assisting the investor in making an informed decision.
However, there are a few differences between how their data is calculated and the representation method. Let’s analyse.
Measuring Price Data
DMA smoothes out market data according to the determined timelines, including small and big price fluctuations and noise. However, EMA is more efficient in this case because it reduces the noise by giving more weight to recent times, helping to provide a more accurate price trend.
Calculation
DMA calculates its data simply by taking the average price of past performance over the selected timeline and indicating them as points on the candle bars or drawing a line starting from the current market price and backwards.
On the other hand, EMA is a weighted average, which gives more value and consideration to recent market movement while taking the average prices of historical data.
Time Lag
The DMA includes time lags and small price actions in its calculation and data collection. Therefore, it helps to analyse tiny fluctuations besides considerable price changes in its representation.
On the other hand, EMA does not include time lags and immediately reacts to price changes, especially recent ones, which makes it more useful to analyse the effects of recent fluctuations on the current trend.
Lags happen in indicators that follow the price. Therefore, they wait for the price data to be updated and produce slightly delayed information.
DMA Use Cases
DMA is used in stock trading to identify entry and exit points through the support and resistance areas, assisting the trader in determining the price trend, including short-period movements.
EMA has more use cases and is mostly beneficial in trend following, such as trend trading strategy because it uses a weighted average model.

Limitations of the Displaced Moving Average DMA
DMA in stocks is useful and can be beneficial in many ways. However, there are some challenges that make it probably not the ideal choice.
- It is better used in conjunction with other indicators, as it cannot work as a standalone indicator.
- The time lag introduced in the DMA may cause traders to miss out on massive opportunities to enter or exit the market.
- It is not useful in volatile markets due to its smoothing mechanism that includes the smallest fluctuations, making it harder to determine trend breakthroughs.
- Sensitivity to outliers, which can sometimes provide incorrect or misleading data.
Conclusion
DMA is used to identify trends using historical price action as a variation of the simple moving average. It provides a rule of thumb on the order execution according to how the price line moves alongside the displaced moving average channel.
Understanding DMA helps the investor find the resistance and support points, indicating an upward or downward trend, signalling a buy or sell order. However, there are some limitations to using the DMA alone. Therefore, it is better used with other tools, charts and indicators.
FAQ
What is the DMA meaning in stock trading?
The DMA meaning in stock trading refers to the Displaced Moving Average, a technical indicator widely used for identifying trends in the market. By shifting the simple moving average forward or backward on a price chart, the DMA meaning becomes essential for traders to predict potential price movements and determine critical support and resistance levels.
How can traders use DMA to find support and resistance levels?
Traders can use DMA as a guide for support and resistance by observing where the price line interacts with the DMA line. If the price line bounces off and falls below the DMA line, it suggests a resistance point and a potential downward trend. Conversely, if the price rises above the DMA line, it indicates a support level and a potential upward trend.
What are the primary advantages of using DMA in trading?
Trend Detection: It helps traders identify the beginning and end of price trends by smoothing out historical price data.
Flexibility: Its ability to shift forward or backward provides a broader perspective on potential price movements across various timeframes.
Recommended articles
By clicking “Subscribe”, you agree to the Privacy Policy. The information you provide will not be disclosed or shared with others.
Recent news
Our team will present the solution, demonstrate demo-cases, and provide a commercial offer


