Complete Guide to Harmonic Patterns for Traders

The complex world of trading in today’s realities requires market participants comprehensive training, including deep knowledge of the laws and mechanics of capital markets, developed personal qualities of strategic thinking and stamina, as well as the use of tools for analysing and forecasting the dynamics of changes in the characteristics and properties of an asset.
The price of an asset is the cornerstone of trading decisions. Harmonic patterns, therefore, play a significant role in assessing the conditions and dependencies of price trend changes.
This article will tell you what harmonic patterns are, what fundamental characteristics they possess, and what types they are divided into in trading practice.
Key Takeaways
- Harmonic trading is based on the idea that market trends are harmonic phenomena, meaning they consist of smaller and larger waves that can help predict future price movements.
- The Fibonacci sequence, beginning with 0 and 1, is created by adding each pair of preceding numbers to get the next in the series: 0, 1, 1, 2, 3, 5, 8, 13, 21, 34, 55, 89, 144, and so forth. These ratios are applied within harmonic patterns to forecast potential reversal points with precision.
- Popular harmonic patterns, such as the gartley, bat, and crab, are widely used by technical traders to identify and anticipate price reversals.
Fundamental Concepts of Harmonic Patterns
Harmonic patterns in trading are structured, geometric price formations based on Fibonacci ratios designed to help traders pin down possible reversal points with greater precision. These patterns, which include the gartley, bat, butterfly, and crab, rely on distinct, measurable proportions between price swings.
By adhering to specific Fibonacci retracement and extension levels, harmonic patterns enable traders to anticipate price movements more accurately, making them a powerful tool for technical analysis.
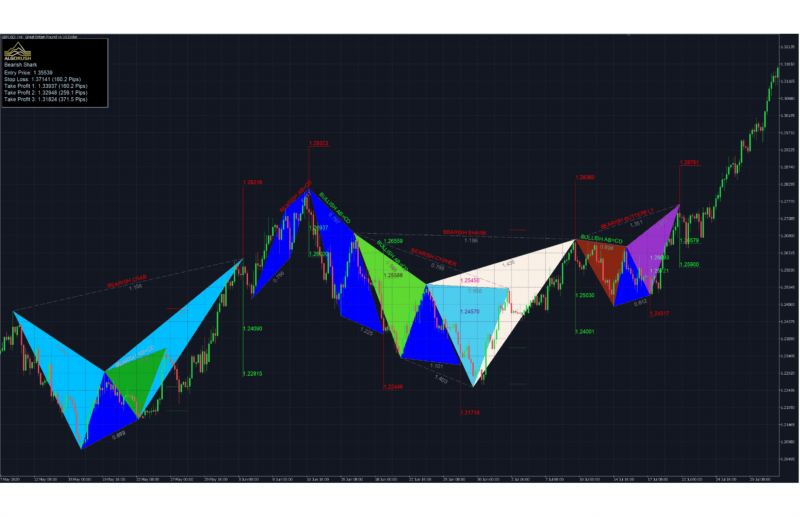
Harmonic patterns are distinct from other chart patterns due to their strict adherence to Fibonacci ratios, which provide a mathematical framework for predicting price changes. Unlike conventional patterns, such as head and shoulders or double tops, harmonic patterns require precise alignment with specific Fibonacci retracement and extension levels, enhancing their reliability when identified correctly.
Such a structured approach allows traders to pinpoint entry and exit points with greater confidence and offers insights into potential areas of support and resistance. By understanding and applying these geometric formations, traders can gain a competitive edge, anticipating price reversals and trend continuations before they fully develop in the market.
Harmonic patterns were first discovered by H.M. Gartley in 1932. The theory was later expanded by Larry Pesavento, who authored the book Fibonacci Ratios with Pattern Recognition, further developing the use of Fibonacci ratios in harmonic trading.
Key Concepts for Trading Harmonic Patterns
Harmonic trading is a precise and structured approach that combines technical analysis with Fibonacci ratios to identify potential reversal points in the market. Here are the essential concepts that every trader should understand to trade harmonic patterns effectively:
Fibonacci Precision and Ratios
Fibonacci ratios are fundamental to harmonic patterns. These ratios, such as 38.2%, 50%, 61.8%, 78.6%, 88.6%, 127.2%, and 161.8%, are derived from the Fibonacci sequence and are used to define key levels within each pattern.
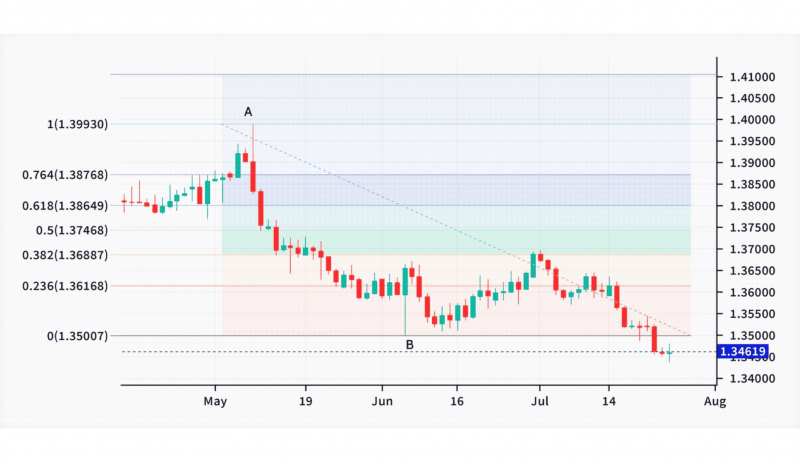
In harmonic trading, each leg of a pattern must adhere to specific Fibonacci retracement or extension levels. For example, in the Gartley pattern, the B point retraces 61.8% of the X-A leg, while the D point completes at a 78.6% retracement. The accuracy of these ratios is critical, as even small deviations can invalidate the pattern and reduce its predictive strength. This reliance on precise measurements gives harmonic patterns their unique structure and helps traders anticipate high-probability reversal points.
Pattern Recognition and Structure
Each harmonic pattern has a unique structure defined by a series of price movements, typically labelled X-A, A-B, B-C, and C-D. Common patterns include the gartley, bat, butterfly, crab, cypher, and shark. Each pattern’s legs align with Fibonacci ratios, providing a systematic way to recognise potential setups.
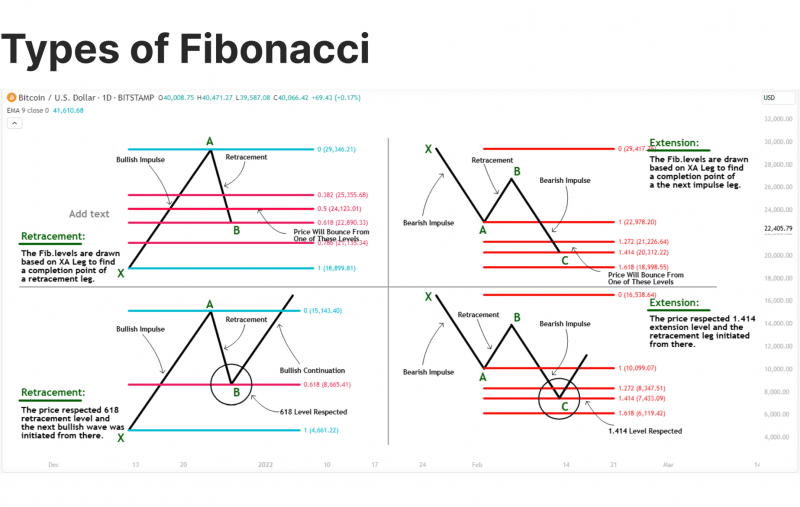
Pattern recognition can be done manually or with the help of harmonic pattern recognition software. While automated tools can assist in identifying patterns, manual verification is recommended to ensure that each leg meets the Fibonacci criteria. Traders who master pattern recognition can spot potential trade setups with high accuracy, giving them an edge in timing entries and exits.
Potential Reversal Zone (PRZ)
The potential reversal zone (PRZ) is a critical area where multiple Fibonacci levels converge in harmonic trading. The PRZ, typically located at point D, is where a reversal is most likely to occur, making it the primary area for trade entry.
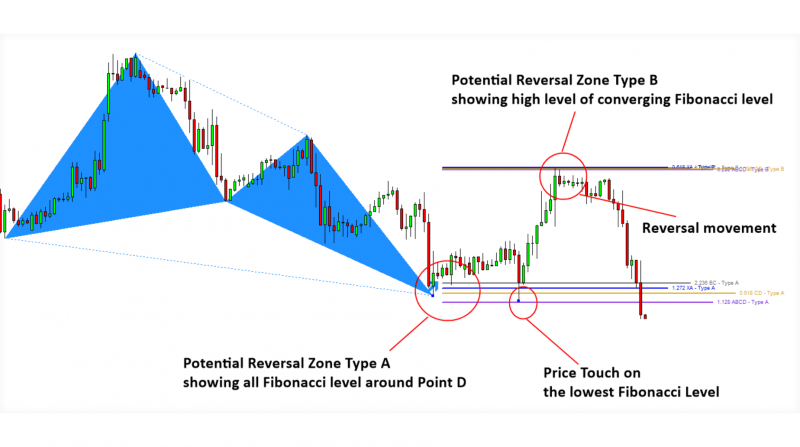
Within the PRZ, traders often look for additional confirmation signals, such as candlestick reversal patterns (e.g., doji, engulfing patterns) or a spike in trading volume, to validate the reversal. The PRZ provides a well-defined entry point with a narrow risk range, allowing traders to set tight stop-loss orders and favourable risk-to-reward ratios.
Confirmation Signals
Relying solely on harmonic patterns may lead to false signals, so using confirmation indicators is a best practice. Popular confirmation methods include candlestick analysis, trend lines, moving averages, RSI (Relative Strength Index), and MACD (Moving Average Convergence Divergence).
For example, if the price reaches the PRZ, traders might wait for a bullish engulfing candle to form before entering a long position. Combining harmonic patterns with other technical indicators helps filter out weaker setups and increases the likelihood of a successful trade.
Risk Management
Effective risk management is essential when trading harmonic patterns. Each pattern provides clear entry points, stop-loss levels, and potential profit targets, allowing traders to calculate risk-to-reward ratios precisely.
Typically, traders set their stop-loss just beyond the PRZ to limit losses if the pattern fails. Profit targets can be based on Fibonacci extensions, such as the 38.2%, 61.8%, or 100% retracement of the D leg. By adhering to these predefined levels, traders can mitigate risk and optimise their returns.
Trade Planning and Execution
Developing a trade plan around harmonic patterns involves setting straightforward entry, exit, and stop-loss levels. Traders should prepare to execute trades as the price approaches the PRZ, and be prepared to exit if the pattern fails. Discipline in trade planning helps traders avoid impulsive decisions, especially in fast-moving markets.
Trade planning also includes monitoring market conditions. Harmonic patterns are most effective in range-bound or sideways markets and can be less reliable in strong trending markets. Traders who are aware of market conditions can adapt their strategies and choose patterns suited to the prevailing trend.
Patience and Practice
Harmonic trading requires patience and practice, as developing an eye for pattern recognition and precision in identifying Fibonacci levels takes time. Not all patterns align perfectly with Fibonacci ratios, and patterns can fail. Practising demo accounts or back-testing patterns on historical data helps traders refine their skills and become more comfortable with harmonic setups.
Have a Question About Your Brokerage Setup?
Our team is here to guide you — whether you're starting out or expanding.
The Most Common Harmonic Patterns
Harmonic patterns are a form of advanced technical analysis traders use to predict price reversals and continuation points. By adhering to strict Fibonacci ratios, these patterns provide a precise framework for identifying potential turning points in the market.
Here’s an in-depth look at the most commonly used harmonic patterns, their structure, Fibonacci levels, and how traders interpret them.
Gartley Pattern
The Gartley pattern, one of the earliest harmonic patterns, is widely used for its reliability and structure. It’s typically seen as an “M” or “W” shape on the chart and is favoured for signalling potential reversals.
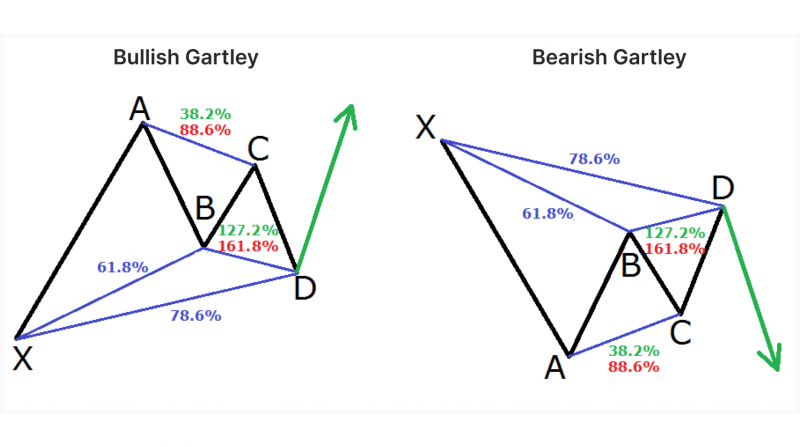
The Gartley pattern has four distinct legs: X-A, A-B, B-C, and C-D. These legs form a specific geometric shape, each meeting strict Fibonacci ratios.
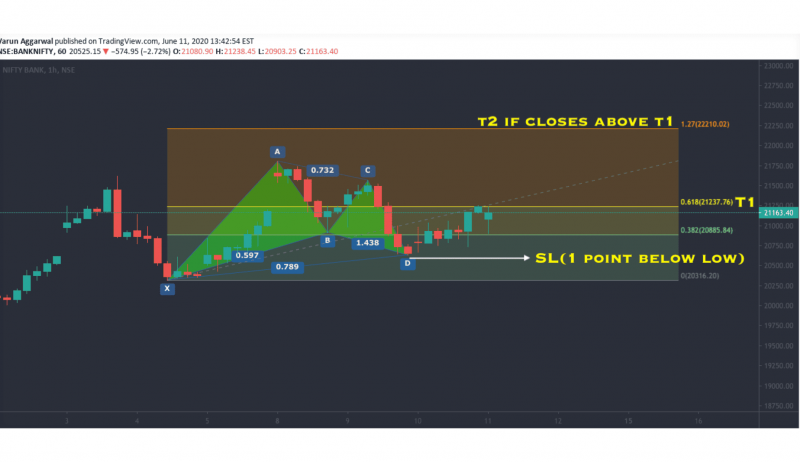
The Gartley pattern suggests a potential reversal at point D, which aligns with the 78.6% retracement of the initial X-A leg. Traders often enter positions at this point, expecting the trend to continue in the original direction of the X-A leg.
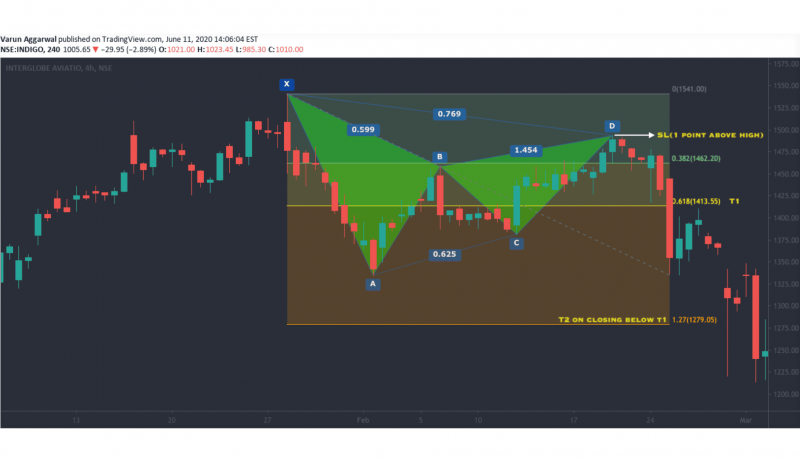
Fibonacci Levels:
A-B: Retraces 61.8% of the X-A leg.
B-C: Can be a 38.2% to 88.6% retracement of the A-B leg.
C-D: Completes at around 78.6% retracement of the X-A leg.
Bat Pattern
The Bat harmonic pattern is similar to the Gartley but has deeper retracement levels, offering more favourable risk-to-reward ratios. This pattern also indicates a reversal but requires different Fibonacci alignments.
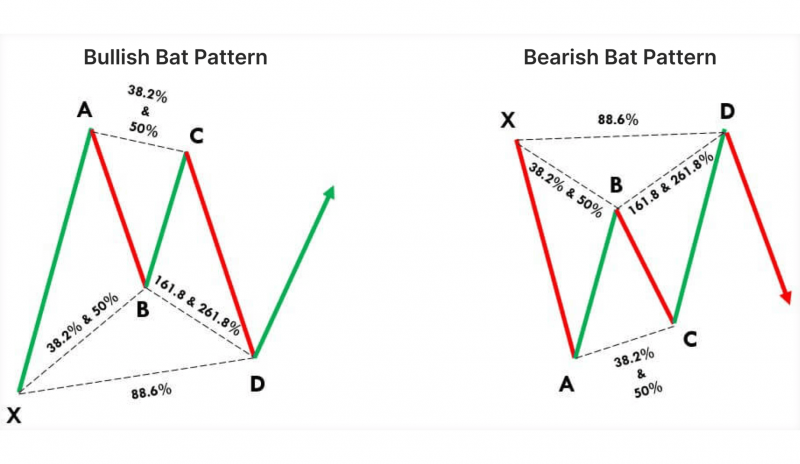
Like the gartley, the Bat pattern consists of four legs (X-A, A-B, B-C, and C-D) but with a deeper pullback.
The Bat pattern is effective for spotting price reversals with a higher probability of success due to its deeper C-D retracement. The 88.6% retracement at point D signals a potential entry, and traders often expect a strong reversal from this level.
Fibonacci Levels:
A-B: Retraces 38.2% to 50% of the X-A leg.
B-C: Retraces between 38.2% and 88.6% of the A-B leg.
C-D: Completes at an 88.6% retracement of the X-A leg.
Butterfly Pattern
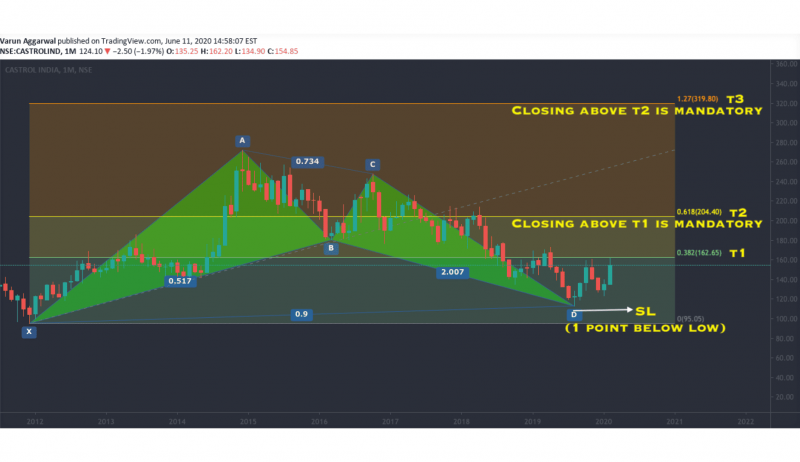
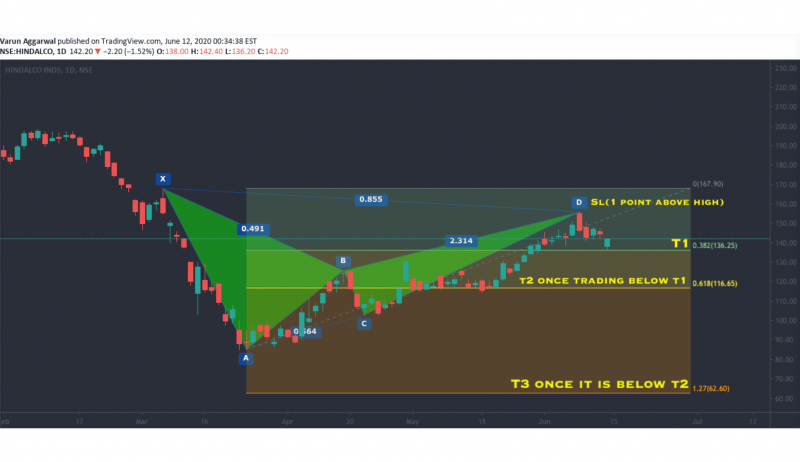
The butterfly harmonic pattern extends beyond the starting X point, creating an “outside” reversal that signals the end of a strong price trend. This pattern is particularly useful for identifying reversals at extreme price levels.
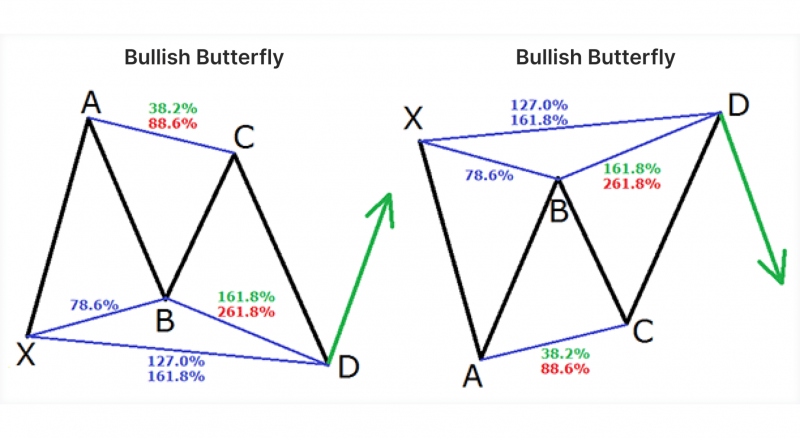
The butterfly has a more pronounced D-point extension, which goes beyond the initial X-point, creating a wide and deep pattern.
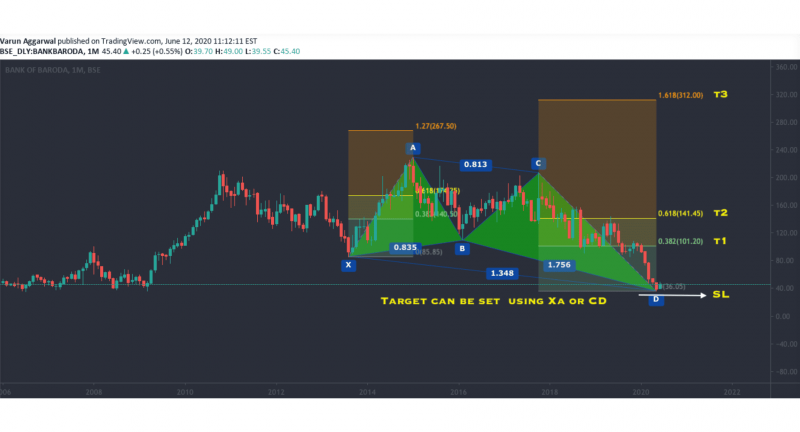
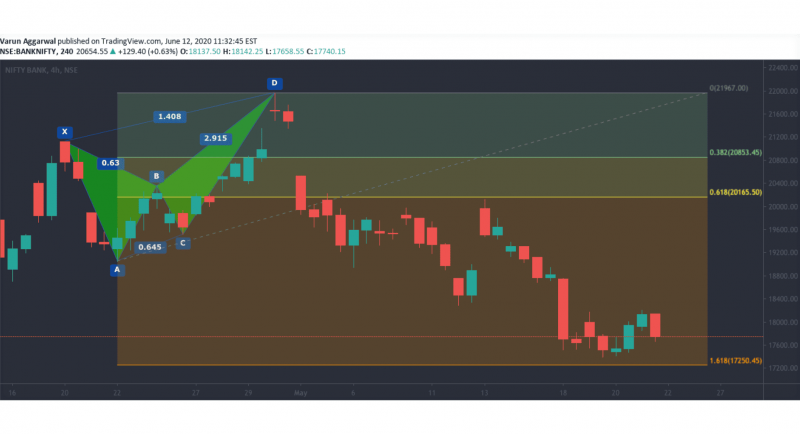
The butterfly pattern often marks the end of a price trend and signals a potential reversal at point D. Since the D point extends beyond the initial trend, it offers a reliable entry point for traders looking to capitalise on a major price shift.
Fibonacci Levels:
A-B: Retraces 78.6% of the X-A leg.
B-C: Retraces between 38.2% and 88.6% of the A-B leg.
C-D: Extends to 127.2% of the X-A leg, often moving beyond the original X-point.
Crab Pattern
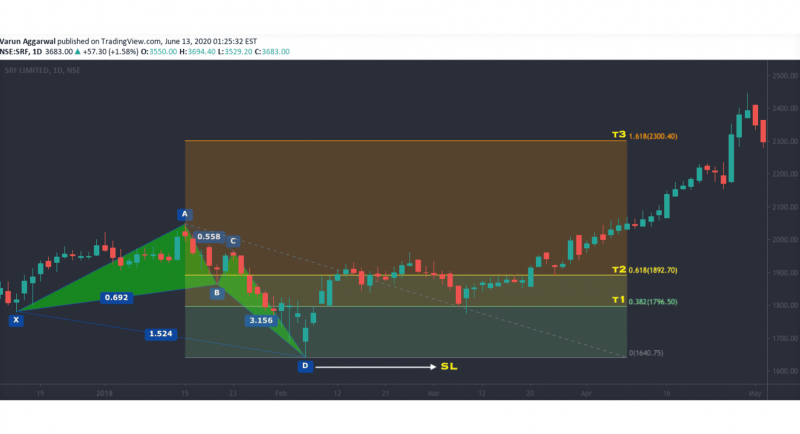
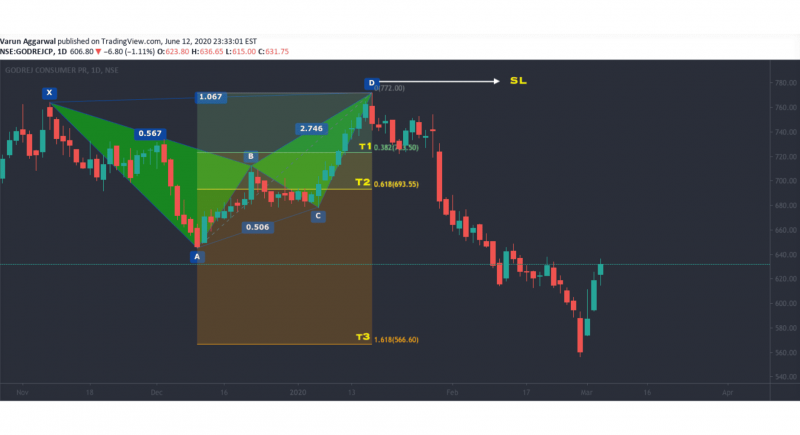
The crab pattern is characterised by its deep extension to the D point, often marking extreme highs or lows. Known for its high accuracy, the crab pattern is particularly useful in volatile markets where price extremes are common.
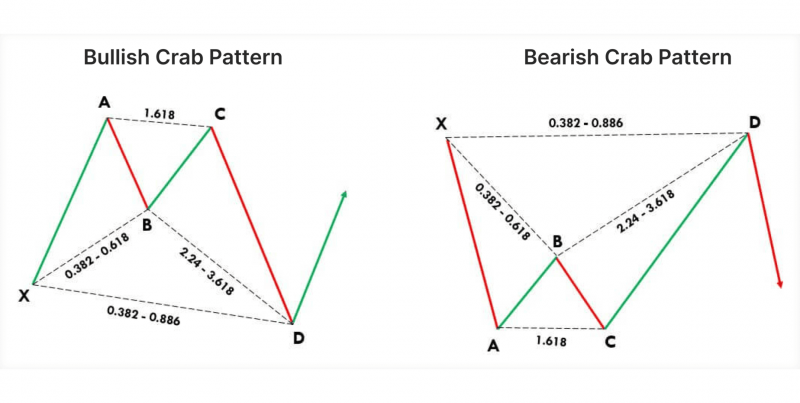
The crab pattern has the deepest D point extension among harmonic patterns, with the D point moving far beyond the initial X point.
The extreme extension of the crab pattern offers traders a strong reversal signal at point D. Due to its deep retracement and unique structure, the crab pattern is known for producing robust reversals, allowing traders to enter at major turning points in the market.
Fibonacci Levels:
A-B: Retraces between 38.2% and 61.8% of the X-A leg.
B-C: Retraces 38.2% to 88.6% of the A-B leg.
C-D: Extends to 161.8% of the X-A leg, making it a significant expansion beyond the initial X point.
Cypher Pattern
The cypher is a relatively newer harmonic pattern that differs from the more traditional ones in shape and Fibonacci requirements. It’s highly reliable when formed correctly and is used to identify reversal points in less volatile markets.
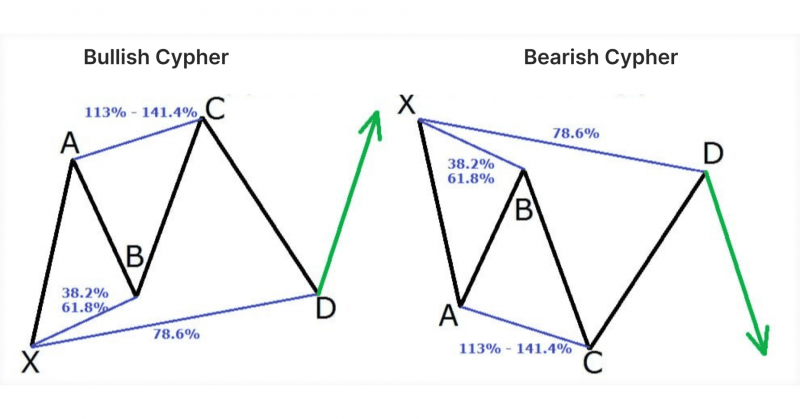
The cypher pattern has unique Fibonacci requirements, setting it apart from classic patterns like the gartley and butterfly.
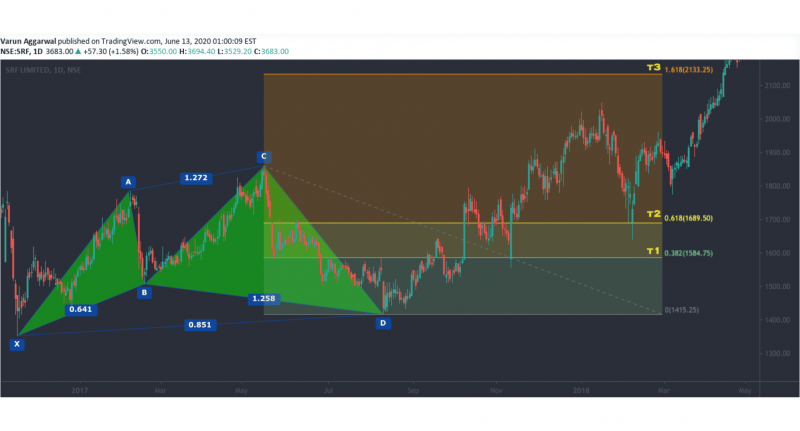
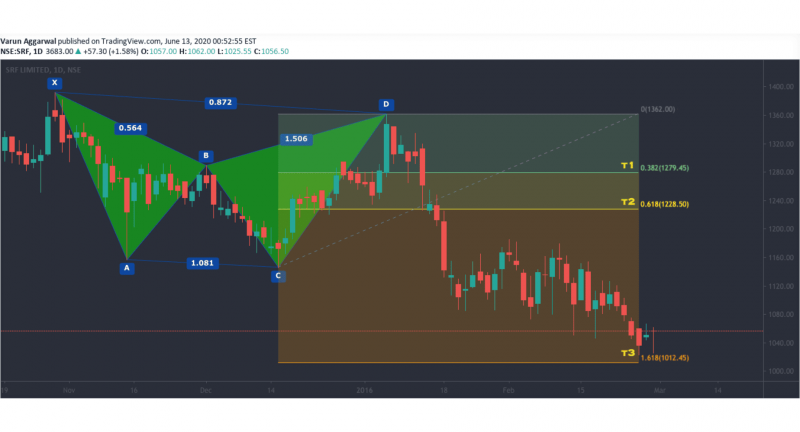
The cypher pattern’s point D, where traders look for entries, is a 78.6% retracement of the X-C leg. This offers a clear reversal point and an attractive entry for traders who want a more conservative, risk-adjusted setup.
Fibonacci Levels:
Discover the Tools That Power 500+ Brokerages
Explore our complete ecosystem — from liquidity to CRM to trading infrastructure.
A-B: Retraces between 38.2% and 61.8% of the X-A leg.
B-C: Extends to 127% of the A-B leg.
C-D: Retraces 78.6% of the X-C leg.
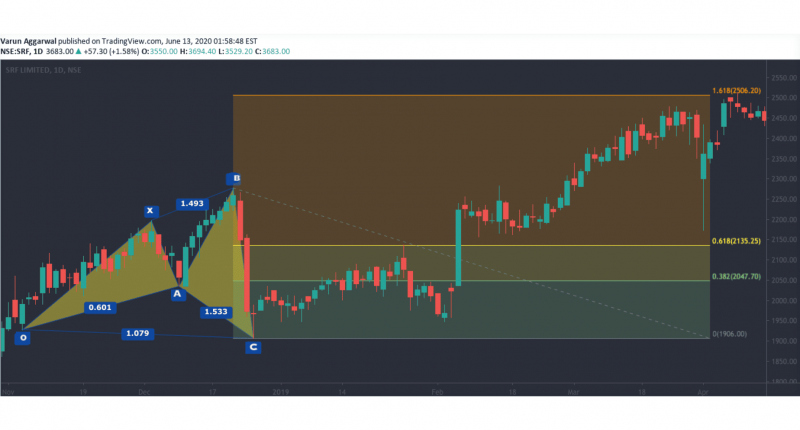
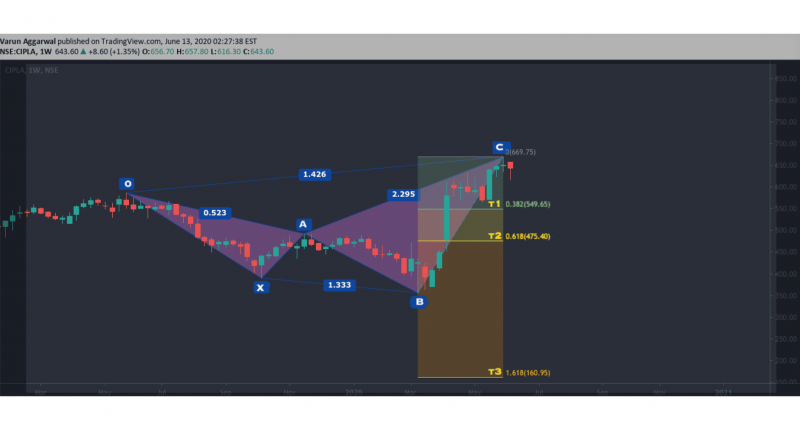
Shark Pattern
The shark harmonic pattern is distinct among harmonic patterns because it has a non-standard structure and relies on different Fibonacci ratios. Often appearing in highly volatile markets, it signals quick reversals with short-term price movements.
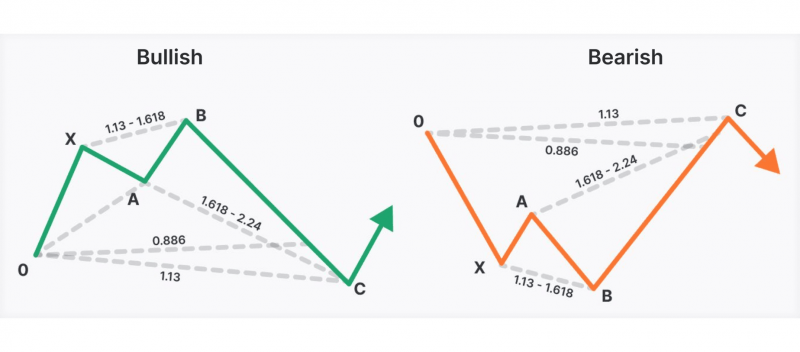
Unlike other harmonic patterns, the shark doesn’t follow the X-A, A-B, B-C, or C-D format. Instead, it has a more fluid structure based on unique Fibonacci extensions.
Fibonacci Levels:
A-B: Reaches a 113% retracement of the X-A leg.
B-C: Retraces between 50% and 88.6% of the A-B leg.
C-D: Extends to 88.6% to 113% of the initial X-A leg, creating a deep potential reversal zone.
The shark pattern is designed for short-term reversals, often appearing in fast-moving, volatile markets. Traders often look for a quick entry at the D point, where the 88.6% to 113% extension marks a potential turning point.
Conclusion
Mastering harmonic trading patterns can significantly enhance a trader’s toolkit, offering precise methods to identify potential reversals and improve trade timing. While harmonic patterns demand a disciplined approach and attention to detail, the rewards are substantial: they provide structured entry, exit, and stop-loss points, optimising risk management.
Whether through the depth of the crab pattern, the cypher’s unique structure, or the butterfly’s symmetry, harmonic patterns offer a pathway to more calculated trading decisions. With patience, practice, and a commitment to understanding these formations, traders can unlock the full potential of harmonic patterns, making them an integral part of a well-rounded trading strategy.
FAQ
What are harmonic patterns in trading?
Harmonic patterns are geometric price formations that traders use to identify potential reversal points.
How do Fibonacci ratios relate to harmonic patterns?
Fibonacci ratios, such as 38.2%, 61.8%, 78.6%, and 127.2%, are the foundation of harmonic indicators. Each leg within a pattern must adhere to a precise Fibonacci retracement or extension level for the pattern to be valid.
What is the potential reversal zone (PRZ)?
The potential reversal zone (PRZ) is a critical area where multiple Fibonacci levels converge within a harmonic pattern, signalling a likely reversal point.
How do traders confirm a harmonic pattern indicator before entering a trade?
To confirm a harmonic pattern, traders look for additional signals within the PRZ, such as candlestick reversal patterns (e.g., bullish engulfing, doji), volume increases, or other technical indicators like RSI and MACD.


