How Liquidity Gaps Erode Broker Revenue at the Worst Times

A liquidity gap does its damage in the exact minutes your volume peaks. On October 10, 2025, a single tariff headline sent crypto markets into the largest liquidation cascade on record. More than $19 billion in leveraged positions evaporated within 24 hours, as market makers stepped back and order books thinned just when selling peaked.
Thin order books and mistimed cash flows both end in the same place, with worse fills and clients who leave without complaining first.
This guide covers how to diagnose whether your firm carries that exposure, how to measure it, and which infrastructure decisions reduce it before the next volatility event.
Key Takeaways
- A liquidity gap hits a brokerage on two levels: cash inflows and outflows that fail to line up, and order books too thin to fill client orders at the quoted price.
- Spread widening and requotes at peak volume usually point to a structural shortfall at the liquidity provider layer.
- Two instruments cover the measurement: a balance-sheet ratio for cash timing and depth-of-market metrics for execution risk.
- A single liquidity provider carrying most of your flow is the clearest structural amplifier, because its outage reaches every client fill at once.
- Aggregation depth, matching engine throughput, and STP execution reduce the risk at its source.
What Is a Liquidity Gap?
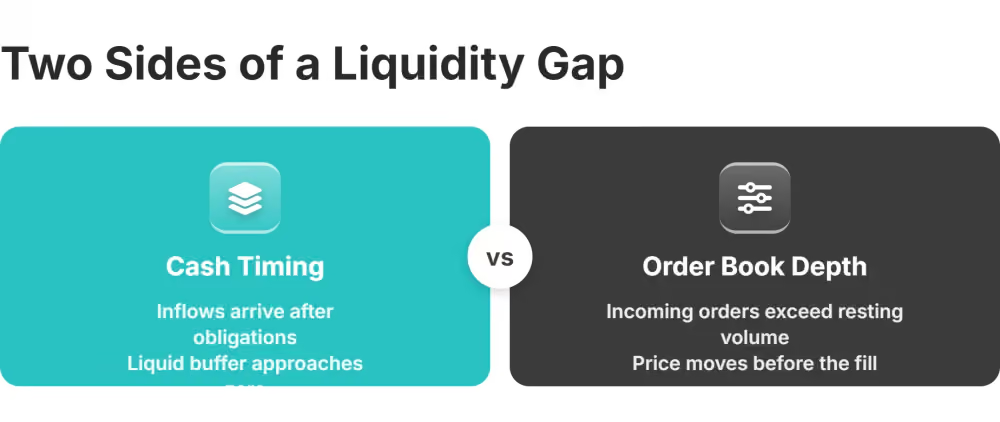
A liquidity gap is a mismatch between expected cash inflows and cash outflows over a defined period. In market-structure terms, the same phrase describes a zone of price levels holding little or no resting order volume. When a market order lands in that zone, it moves the price sharply before finding the other side.
The term operates in three contexts: bank balance sheets, business cash management, and order book depth in financial markets. A brokerage touches all three at once.
Why Liquidity Gaps Matter for Operators
For a brokerage, the mechanism is simple. When clients lose more than their account equity, the shortfall lands on the firm. That alone has closed real companies. Alpari UK went insolvent after the Swiss franc surged in 2015 and blamed "exceptional volatility and extreme lack of liquidity" for the client losses it had to absorb.
An event of that scale is rare. In the more common, quieter pattern, fills degrade a little during every data release, and the cost accrues in small increments across spreads, hedging bills, and client goodwill.
Liquidity Gaps Across Three Business Contexts
Each context produces a different failure. Knowing where each one originates tells you which lever fixes it.
Banking: Regulatory Constraints and Downstream Effects
For a bank, a liquidity gap is a maturity mismatch. Money lent out comes back later than the bank's own obligations fall due, and managing that timing is the core job of asset-liability management.
Basel III's liquidity coverage ratio (LCR) polices that mismatch by requiring banks to hold enough liquid assets to survive 30 days of stressed outflows . The rule was written after 2008, when banks ran out of cash faster than they could raise it.
A bank protecting that buffer lends less freely. Short-term funding lines shrink and margin facilities get more expensive. A brokerage that funds settlement or margin through bank credit inherits the squeeze without any change in its own risk profile.
The practical response is to spread funding across several institutions, so no single bank's buffer management dictates your settlement calendar.
Market Structure: Order Book Imbalances and Execution Voids
An execution void opens when resting volume at a price level cannot absorb incoming flow without moving the price. Providers pull quotes or widen spreads around macro releases and session handoffs to protect their inventory, so the voids cluster at predictable times on predictable instruments.
August 2024 showed the mechanism at full scale. When the yen carry unwind hit, the TOPIX lost 12% in a single day and the VIX briefly returned to Covid-era levels. Deleveraging and mid-event margin increases amplified the initial shock.
The same episode reached crypto within hours, where sharp price declines took Bitcoin and Ethereum down as much as 20% while retail margin calls added to the pressure.
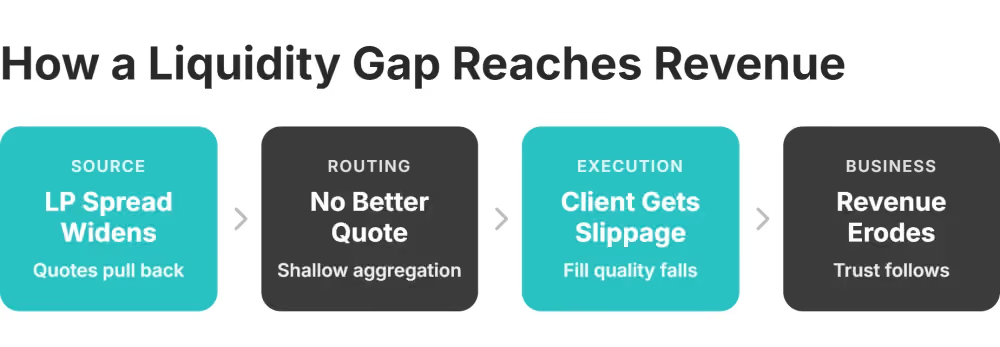
For an aggregating brokerage, a void shows up as simultaneous widening across sources. If the aggregation layer is shallow, no tighter price exists to route to, and the widened spread reaches the client.
A firm holding the same flow on its own book faces the mirror image. Client positions stay open through the void, and the mark-to-market swing lands on the firm.
How Liquidity Gaps Affect Brokerages
From the operator's side of the desk, the damage runs through two mechanics: spread economics and client retention.
Spread Widening and Execution Quality Degradation
An A-Book brokerage passes provider pricing through to clients, so a widened LP spread reaches client fills directly. Revenue comes under pressure at the same moment. A fixed markup does not grow with the spread. The firm either absorbs the widening to stay competitive, or passes the full cost through and watches trade count fall.
The damage compounds through repetition. Clients accept one widening episode as a market event; when it returns at every payroll release, they start attributing the fills to the broker.
Slippage, Requotes, and Client Retention Risk
Slippage means an order fills away from the requested price because no depth exists at that level. A requote means the provider rejected the fill and returned a new price. Both numbers sit in your execution logs, and both sit in your best clients' trade journals too.
That second audience is the retention risk. High-volume traders and institutional investors compare venues on months of fill data, then migrate without filing a complaint. The flow they take with them tends to be the most profitable slice of the book.
Crypto desks see the sharpest version, since thin altcoin order books produce slippage that active traders notice within a single session.
Measuring Your Firm's Liquidity Gap Exposure
A complete liquidity gap analysis works on two layers. The balance-sheet ratio sees cash timing risk; order book diagnostics see execution risk. Each catches what the other misses.
Current Liquidity Gap Ratio
The formula for Current Liquidity Gap Ratio is:
(Liquid Assets − Short-Term Liabilities) / Total Assets
For a brokerage, liquid assets are the short-term assets a firm can convert quickly: operating cash, unencumbered deposits, and marketable short-term instruments. Short-term liabilities cover pending settlements, open margin obligations, and the client withdrawal queue.
Read the output as a buffer gauge. A comfortably positive number means obligations should clear without emergency funding. A number near zero means the buffer is almost gone, and daily operations hide that until a withdrawal spike exposes it.
A negative number is a structural shortfall that only bridge funding or asset sales can close. That is a liquidity problem well before it becomes a solvency one.
Run the calculation daily across each settlement time bucket, then rerun it under an elevated-withdrawal assumption. The gap that looks manageable in an average week is the one that turns acute after a major market move.
Depth-of-Market Metrics and Order Book Diagnostics
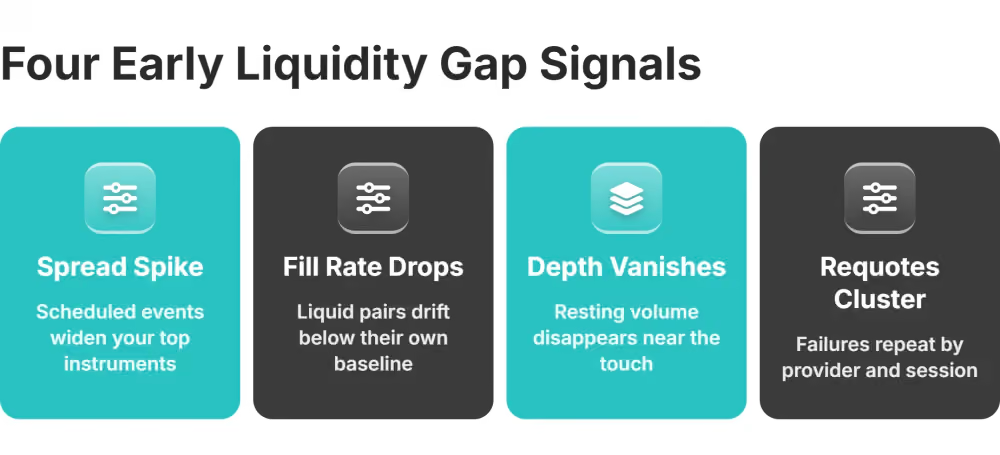
Balance-sheet ratios update too slowly to catch an execution problem, so pair them with order book data. Four signals earn a standing dashboard:
- Spread behavior during volume spikes. How far your top instruments widen at each scheduled release.
- Fill rate trend by instrument. A drifting fill rate on liquid pairs points at provider-side depth before any client says a word.
- Resting depth around the touch. Shrinking volume at the levels nearest the market price is a pre-gap condition.
- Requote frequency by session. Requotes clustering at specific hours identify which provider thins out, and when.
Set alert thresholds from your own history, because the pattern that matters is deterioration against that baseline. Feed both layers into a recurring liquidity gap report that puts the cash and execution views on one page.

Liquidity Gap Signals for Your Business
Five patterns show up repeatedly in firms carrying structural liquidity risk, and each is an early marker of a liquidity crisis you can still head off:
- Cash timing keeps missing. Withdrawal queues exceed available settlement cash on high-volume days while the P&L stays healthy.
- Every data release widens your book. If spreads on your most-traded instruments blow out at each scheduled event, the aggregation layer lacks depth.
- Execution complaints cluster. Complaints tied to one session window or one instrument usually name the provider whose depth fails at that hour.
- Hedging costs rise without a flow change. Provider pricing has structurally widened, or your volume has outgrown the provider's capacity.
- One provider carries most of the flow. Whatever happens inside that firm happens to your fills seconds later.
The cash side of this checklist has its own toolkit. The main liquidity ratio families each reveal a different layer of balance-sheet exposure, and they slot in next to the execution signals above.
Liquidity Gap Risk Management Best Practices
The diagnostics only pay off when they feed standing liquidity risk management, built on three disciplines.
Liquidity Forecasting and Cash Flow Scenario Planning
Forecast at daily granularity, separating contractual cash flows like scheduled settlements from behavioral ones like client withdrawals.
Month-end aggregates smooth over the exact mismatches that cause trouble. A T+2 settlement lands the day after a wave of margin calls, or withdrawal demand surges right after a violent market move, and the monthly view never shows it.
Build three standing scenarios. Start with a normal-operations baseline, add an elevated-volatility state with heavier withdrawals and margin calls, and finish with a stressed state where the primary provider disappears for hours and backup pricing arrives wide. Write the management response for each state in advance, so nobody improvises it live.
Stress Testing at the Firm Level
This is internal operational testing, separate from anything a regulator asks you to file. A useful test answers one question: If the primary provider triples its spreads while client withdrawal requests spike, do orders keep filling and settlements keep clearing?
Real stress supplies the parameters. During the August 2024 unwind, Japan's clearing corporation raised initial margins on long equity index positions by 60–80% while volatility spiked. Leveraged firms met bigger collateral calls at the worst possible prices.
The ECB expects the banks it oversees to identify and mobilize collateral quickly under stress . Its reviews keep finding overly optimistic assumptions about how fast assets turn into cash. The same standard fits a brokerage. Know today which assets can become settlement cash by tomorrow morning.
Diversifying Liquidity Provider Relationships
Dependence on one provider is the clearest structural cause of gap amplification. During the 2015 franc event, Global Brokers NZ reported that both its primary and backup providers went unresponsive or illiquid for hours. Every client fill went down with them, and the firm closed.
Aggregation across several providers changes the mechanics. When one source widens or drops, the engine routes to the next best price, and the client rarely sees the failure.
The provision model matters too, since agency, market-making, and hybrid structures each place the residual dependency in a different part of the operation.
Infrastructure Decisions That Close Liquidity Gaps
Diagnostics and process limit the damage, while architecture removes the cause. Three decisions do most of the work.
Liquidity Aggregation and Multi-Asset Pool Depth
Pool depth decides whether a stress event reaches your clients. A firm pricing from one source has no alternative when that source widens.
A firm aggregating Tier-1 banks, non-bank market makers, and crypto venues has competing streams for every fill. A widening quote gets beaten by a tighter one before it can pass through.
A multi-asset liquidity offering such as B2BROKER's covers 10+ asset classes, from FX and crypto CFDs to indices, metals, and fixed income. Its job is to supply that competing-quote depth on the instruments where single-source books run thin.
Matching Engine Design and Execution Architecture
Throughput determines how many orders clear before the spread moves again. During a gap event, prices reprice in milliseconds, so an engine that processes its queue faster fills more clients at the price they actually saw.
B2TRADER , B2BROKER's multi-asset trading platform, pairs that processing speed with margin netting and configurable leverage. The netting matters here because offsetting client exposure cuts the gross volume the firm itself must hedge into a stressed market.
STP and NDD Models: Reducing Intermediary Risk
Straight-through processing removes the manual desk from the execution chain, which removes the desk's queue at exactly the moment it saturates. A no-dealing-desk model routes flow directly to liquidity, so the firm avoids holding client risk on its own book through the void.
The audit trail improves as a side effect, because every fill maps to a provider quote, which settles execution disputes with data.
Liquidity Gaps Are a Business Problem
The same condition appears at three altitudes. On the client's screen it is a requote, on the balance sheet a working-capital squeeze, and in the architecture diagram a single provider connection with no failover.
Fixing it at the infrastructure layer keeps the two layers above from ever registering the event.
Closing a liquidity gap for good means rebuilding that bottom layer. B2BROKER builds it as one stack. Multi-asset liquidity, the B2TRADER platform, and the back office arrive as a single vendor relationship rather than a chain of separate integrations.
If these signals look familiar, your exposure is already measurable, and the fixes are mature technology rather than research projects. The next step is to see where your own setup sits against them.
Frequently Asked Questions about Liquidity Gaps
What is a liquidity gap in finance?
It is a mismatch between expected cash inflows and outflows over a defined horizon. In market-structure usage, it is a shortfall of resting order book depth at current price levels. Both versions carry direct operational costs for trading businesses, from wider spreads to delayed settlements.
How do liquidity gaps affect a brokerage or exchange?
The first symptoms are spread widening, slippage, and requotes during peak-volume windows. Repeated episodes erode client trust and push high-volume traders toward better-filled venues, while cash-timing mismatches add margin pressure behind the scenes.
How is a liquidity gap measured at the firm level?
Brokerages track a balance-sheet ratio (liquid assets against short-term obligations) alongside depth-of-market metrics such as spread behavior during volume spikes and fill rate trends. The ratio catches cash-timing risk; the market metrics catch execution risk in real time.
How can firms reduce liquidity gap risk?
Daily liquidity forecasting, firm-level stress testing, and diversified provider relationships form the operating core. Since a single provider's outage cascades straight to client fills, spreading flow across several pricing sources removes the largest single point of failure.
What infrastructure decisions help close liquidity gaps for brokerages?
Aggregating liquidity across Tier-1 banks, non-bank market makers, and crypto venues keeps competing quotes available during stress events. Matching engine throughput matters alongside it, since a faster engine fills orders before a widening spread moves further. Integrated stacks such as B2BROKER's combine both in one vendor relationship.
Recommended articles


Subscribe to our newsletter