Spinning Top Candle: What is it, and What Does it Tell You?

Trading is one of the most profitable but, at the same time, risky activities. To reduce the risk as much as possible, it is necessary to use different strategies and tools, which require appropriate knowledge and experience.
Understanding how to interpret price sideways movement is crucial for making informed trading decisions in the financial markets. Candlestick charts, a popular technical analysis tool, offer valuable insights into future price reversal through visual patterns. One such pattern, the spinning top, plays a significant role in deciphering market sentiment.
Known for its distinctive shape, the spinning top candle represents indecision in the market, often signalling a potential reversal or a moment of uncertainty. For both seasoned and beginner traders, recognising a spinning top candlestick pattern can be a powerful insight into market dynamics.
In this article, we will explore the fundamentals of the spinning top candle, its formation, and how it fits into broader candlestick patterns.
Key Takeaways
- The spinning top candlestick pattern signifies indecision in the market, with neither buyers nor sellers gaining a clear advantage.
- It features a small real body positioned in the centre, flanked by long upper and lower wicks, resembling a spinning top toy.
- They can foreshadow potential trend reversals, especially after strong price movements, or indicate extended sideways trading periods.
What is a Spinning Top Candle?
A spinning top candlestick is a specific type of candle on a price chart that signals market indecision. Visually, it has a short body and long upper and lower shadows (or wicks), which generally means that neither buyers nor sellers were able to gain control during that period.
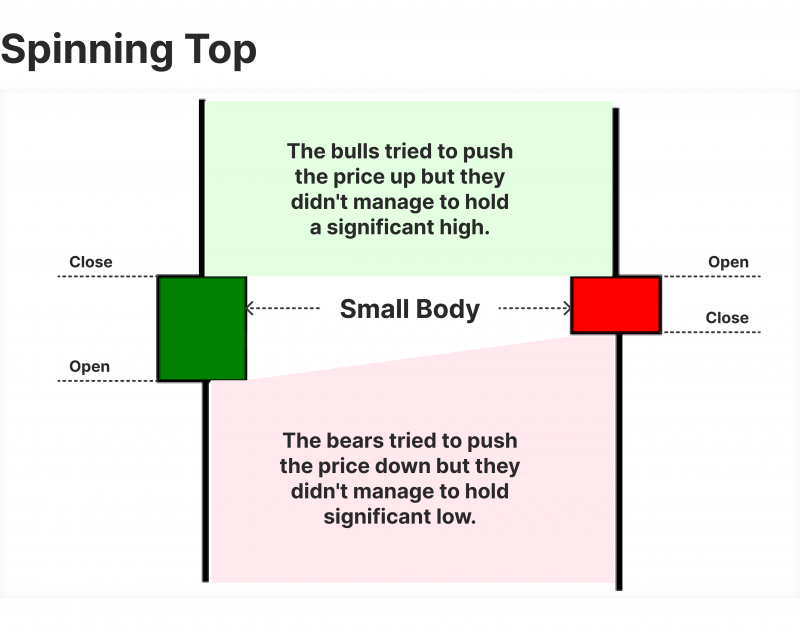
The short body indicates that the opening and closing prices are very close, while the long shadows show that the price fluctuated significantly in both directions before closing near its open price.
Characteristics
- Small Body: Indicates a narrow range between the opening and closing prices, signifying indecision.
- Long Shadows: Suggest volatility, with price movements to both the high and low points within the period.
- Colour of the Candle: Can be either bullish (green or white) or bearish (red or black), though the colour is less significant for this pattern.
- Upper Wick: Long and pronounced, signifying an attempt by buyers to push prices higher.
- Lower Wick: Equally long, reflecting selling pressure that pushed prices down
The essential characteristic is the balance between the long wicks and the small real body. This balance signifies that neither buyers nor sellers were able to maintain control during the trading period, resulting in a closing price close to the opening price.
Understanding Market Sentiment Through the Spinning Top
The spinning top candlestick pattern is widely recognised as a symbol of market indecision, meaning that both bullish and bearish forces are somewhat balanced. While this indecision doesn’t guarantee a reversal, it often acts as a cautionary signal for traders who may be looking to enter or exit a position.
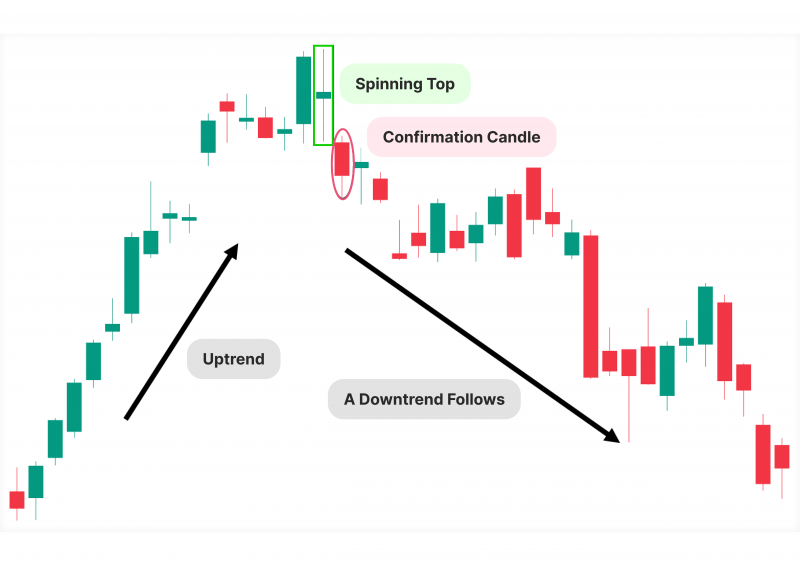
Imagine a scenario where a stock’s price has been climbing steadily, and suddenly a spinning top candle appears. This could indicate that buyers are no longer dominating the market and that sellers have entered, possibly suggesting a slowdown in the bullish trend.
Conversely, if it appears after a series of declines, it could imply that the selling pressure is losing steam.
Have a Question About Your Brokerage Setup?
Our team is here to guide you — whether you're starting out or expanding.
Trend Reversal Signals
When a spinning top appears at key market positions, it can signal potential trend reversals:
- At the peak of an uptrend: May indicate weakening bullish momentum
- At the bottom of a downtrend: Could suggest diminishing bearish pressure
- Within a range: Often confirms ongoing market indecision
Identifying the Longest Spinning Top
While spinning tops generally indicate indecision, their impact can vary depending on the size of their wicks. Some traders look for the longest spinning top, as these patterns with exceptionally long shadows may represent heightened volatility and, thus, a stronger indication of an impending shift in market sentiment.
In highly volatile markets, a longer spinning top often suggests more vital uncertainty and could mean a more dramatic reversal if the trend changes. For instance, during economic announcements, longer spinning tops may form due to rapidly shifting sentiments among traders.
A spinning top is a symbol of good luck and prosperity. In Native American cultures, tops were used for divination and spiritual rituals, and their revolving motion was believed to provide insights into the future.
The Role of Spinning Tops in Bullish and Bearish Candlestick Patterns
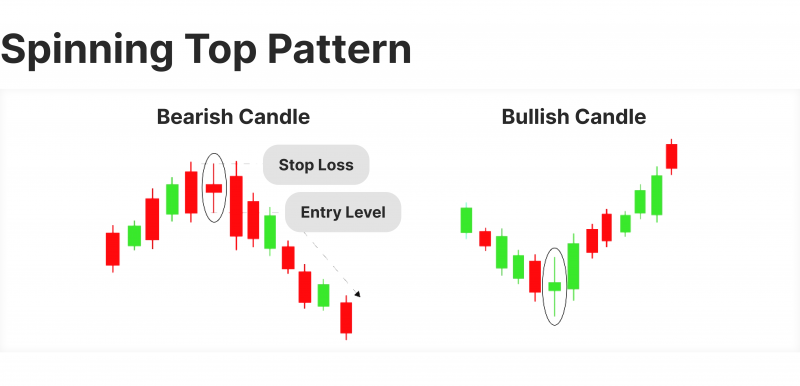
The spinning top candlestick is versatile and can appear in bullish and bearish patterns. While it doesn’t necessarily indicate a trend reversal by itself, it’s often found within patterns that do. Understanding its context can provide further insights.
Bullish Reversal Patterns
Sometimes, the spinning top appears after a downtrend, forming a part of reversal patterns such as the morning star. Here, it serves as an early signal that bears may be losing momentum, potentially followed by a bullish candle that confirms the upward trend.
Bearish Reversal Patterns
On the other hand, a spinning top in an uptrend might precede a bearish reversal pattern, such as the evening star. In this case, it hints at weakening buying pressure, and the subsequent bearish candle can confirm the trend reversal.
Whether appearing in a bullish or bearish trend, the spinning top candle’s primary purpose is to alert traders to the market’s hesitation, making it a valuable element in a common candlestick pattern cheat sheet.
Practical Use of the Spinning Top Candlestick Pattern in Trading
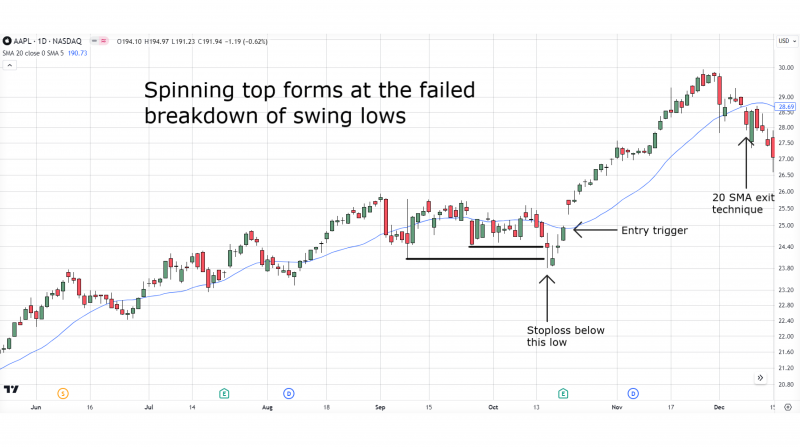
To effectively incorporate the spinning top pattern into a trading strategy, it is essential to consider several factors.
Entry and Exit Strategies
Successful trading requires:
- Pattern recognition and confirmation
- Context analysis of market conditions
- Integration with other technical indicators
- Risk management implementation
Confirmation Signals
Traders should wait for confirmation before taking positions based on spinning top patterns. Confirmation typically comes from:
- The following candle’s direction
- Supporting technical indicators
- Volume analysis
- Price action at crucial support/resistance levels
When trading spinning top patterns:
- Use appropriate position sizes
- Consider the pattern’s location relative to key levels
- Account for market volatility
- Implement proper stop-loss orders
Let’s say you spot a spinning top in a stock that’s been on an uptrend. You might wait for the following candle to prepare for a potential price drop. If it closes bearish, you could short the stock with a stop-loss above the high of the spinning top.
Pairing with Other Indicators
Like any technical indicator, spinning tops should not be used in isolation. To solidify trading decisions, consider incorporating other technical analysis tools:
Support and Resistance Levels: A spinning top near support might signal a potential bounce, while one near resistance might indicate a struggle to break through.
Moving Averages: A spinning top after a price surpasses a moving average could indicate a potential pullback.
Volume: The high volume accompanying a spinning top can amplify its significance.
Doji: Both patterns represent indecision, but a Doji has a near-absent real body, while a spinning top has a small but visible real body. Dojis often signal a potential reversal, while spinning tops can indicate a pause or consolidation phase before a trend continuation or reversal.
Discover the Tools That Power 500+ Brokerages
Explore our complete ecosystem — from liquidity to CRM to trading infrastructure.
When combined with the spinning top pattern, these tools offer a more comprehensive picture of market sentiment and potential future price trends.
Remember: While the spinning top is a valuable tool for technical analysis, it’s crucial to use it in conjunction with other indicators and consider the broader market context. By understanding the nuances of this pattern, you can enhance your trading strategies and make more informed decisions.
Japanese Candlestick Patterns Cheat Sheet
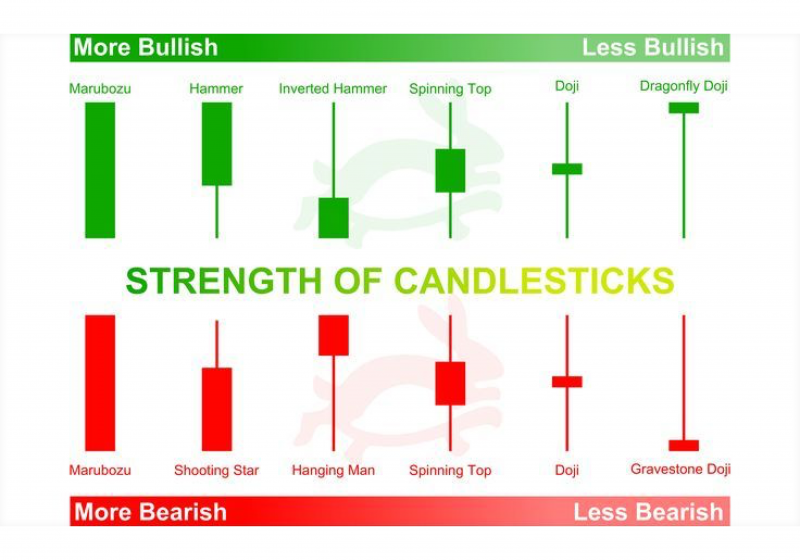
In Japanese candlestick patterns, the spinning top has its place. Here are a few patterns where this candle might fit:
- Morning Star Pattern: Often signals a bullish reversal, with the spinning top as the middle candle.
- Evening Star Pattern: Often indicates a bearish reversal, with the spinning top signalling indecision before the drop.
- Doji Patterns: While not identical, the spinning top and doji patterns both reflect indecision and are frequently used together in market analysis.
Each of these patterns can help traders quickly interpret the market’s psychology and make more informed trading decisions.
Conclusion
The spinning top candlestick is a critical pattern for traders aiming to interpret shifts in market sentiment. Its appearance on a price chart doesn’t always indicate a trend reversal but does represent a moment of indecision that traders should consider. The spinning top candle can provide a well-rounded view of market dynamics and potential price movements when used alongside bullish candlestick patterns or support and resistance levels.
Remember that effective trading involves more than just pattern recognition – it requires a holistic approach incorporating multiple technical analysis tools, proper risk management, and continual learning and adaptation to market conditions.


