The Best Trend Indicators for Trading

To become a skilful trader, one has to understand the basics of analysis, planning and flawless trade execution. However, everything starts with assessing the market and identifying the price movement patterns. Trend indicator analysis is a go-to trading strategy, letting traders make informed guesses about expected price changes.
While the core nature of trading can be boiled down to betting on the right assets and disposing of the wrong ones, this expansive market is much deeper than it appears at first glance. There are numerous intricacies and concepts to be learned for aspiring traders who wish to become successful in this competitive field. The article will present some of the best trend indicators to enhance and improve your trading strtegies.
Key Takeaways
- Trend trading is an excellent strategy that allows investors to make data-informed forecasts regarding asset price changes.
- Trend indicators assist traders in visualising asset price momentums and expected price swings.
- Popular trend indicators include the Bollinger Band, MACD, Relative Strength Index, On-Balance Volume (OBV) and the Parabolic SAR.
- Each trend indicator analyses prior asset data to forecast future pricing movements.
What Is Trend Trading?
As the name suggests, trend trading is a practice of identifying and acting on profitable market trends. Trend trading has been empirically proven as a sound and effective strategy across various financial markets and other trading sectors. Despite different economic, political, social and technical conditions, all trading assets follow a particular progression. Each tradable asset is either going down, up, or maintaining its current price.
The purpose of trend trading is to analyse available data and forecast the probable future trends for a particular asset. For example, if asset A is going up, traders can utilise the trend trading practices to understand this pattern’s nature better. With this analysis, traders could discern that asset A has just started its upward momentum and isn’t slowing anytime soon. Conversely, trend analysis could inform the traders that asset A’s growth cycle is over, and the investment window is closed.
While the above-outlined example is trivialised, it effectively showcases the nature of trend trading. While this practice is far from precise, it has shown favourable results in most cases. Naturally, trend trading does not guarantee success, as numerous unpredictable developments exist across trading industries.
However, the law of averages has repeatedly proven that trends repeat themselves, regardless of the industry or specific market conditions. Thus, trend trading has become one of the most popular trading strategies globally, letting investors acquire a clearer picture of the trading market and execute deals based on complex data.
What Are Trend Indicators?
Investors must get acquainted with various trading indicators that simplify the market assessment to conduct trend trading analysis. In essence, trading trend indicators allow investors to identify the bigger picture of asset price movements. As a result, investors don’t have to rely on surface-level analysis to acquire successful assets or dispose of the losing ones.
Aspiring traders can employ numerous technical indicators to simplify their investing strategies. Regardless of their specific calculations and formulas, all indicators aim to paint a picture regarding the asset’s near future. As the trading markets have been around for centuries, there is a lot of data to analyse and create mathematical models that describe the probable trend continuations. As mentioned above, trend indicators are helpful and highly effective tools regardless of the specific trading industry.
They also accommodate different types of trading, including short, long, hold and swing trading practices. While capitalising on asset trends is more suited for long-term traders, it can also be used for short-term gains. Naturally, trend indicators paint a clearer picture of some industries than others. For example, this practice can be less effective in the case of the crypto market, as it is a relatively young sector. Moreover, the crypto field remains volatile and quite unpredictable due to the tectonic shifts related to the crypto economy and regulations.
Thus, trend indicators might struggle to forecast these unpredictable developments in the crypto market. However, with enough diversification and careful investment, trend indicators have proven useful even in the most volatile markets. Yet, it is advisable to remain vigilant in volatile markets, as trend indicators can be more misleading.
Even the most informative and insightful trend indicators should be used in combination with others, as a single indicator is likely to provide a skewed or misleading picture of the market.
The Best Trend Indicators on The Market
While all trend indicators serve the same purpose of catching price movement trends, they come in different forms and provide unique analyses. There are numerous types of indicators to choose from, and they all offer a specific style of assessing the probable price movements. The five indicators below are the most popular and widely adopted analysis tools. Let’s discuss them in greater detail.
#1 – The Bollinger Band (BB) Indicator
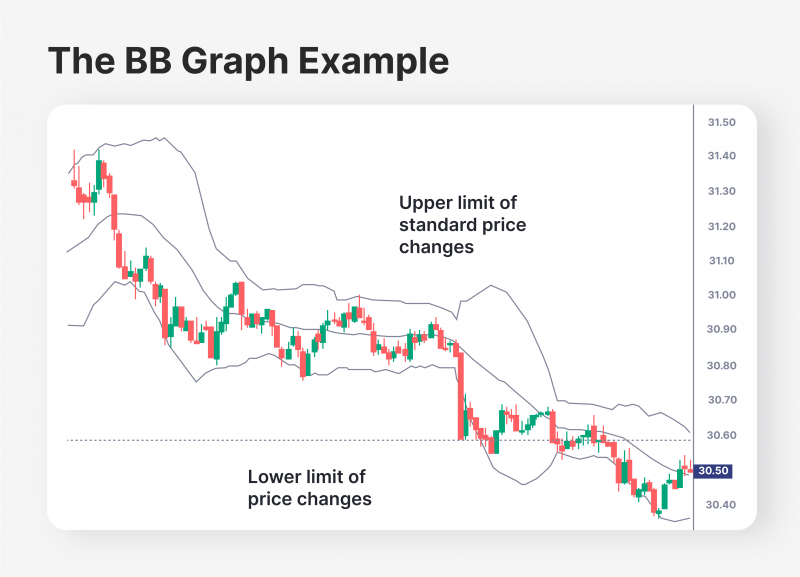
The Bollinger Band, the first technical indicator in this list, might be the most utilised indicator on the global market. The BB indicator uses the mathematical concept of standard deviation to identify the unusual outliers in pricing movements. The standard deviation formula was invented to identify outlier data points in a data set. Naturally, identifying outlier pricing trends is crucial in the trading markets, and the BB indicator allows investors to visualise these breakpoints simply.
The BB indicator employs three bands to visualise the price movement graph. The upper and lower bands represent standard deviations. If the asset price crosses either of these bands, it is considered an outlier event.
But why are the breakpoints important, exactly? They indicate that an asset price has hit an unexpected figure, which is highly likely to be corrected by the market. For example, imagine that asset A has steadily increased for the past three months. However, during a short 2-day period, asset A suddenly appreciated by 40%. This price movement is well outside the BB indicator’s top band. Therefore, it is probable that asset A is overbought and is bound to enter a price-decreasing trend shortly. While asset A might continue this unlikely trend, the BB indicator states that it is not likely. Investors can continue to hold the asset, but it is probable that asset A is about to lose its value and return within the standard deviation interval.
The same is true for the inverse of this use case. If asset A’s price drops below the standard deviation, chances are that the asset is currently undervalued, and it might be a great time to invest. Thus, the BB indicator can identify overbought and oversold conditions for specific investments, which makes it one of the most essential indicators available on the market.
#2 – The Moving Average Convergence Divergence (MACD) Indicator
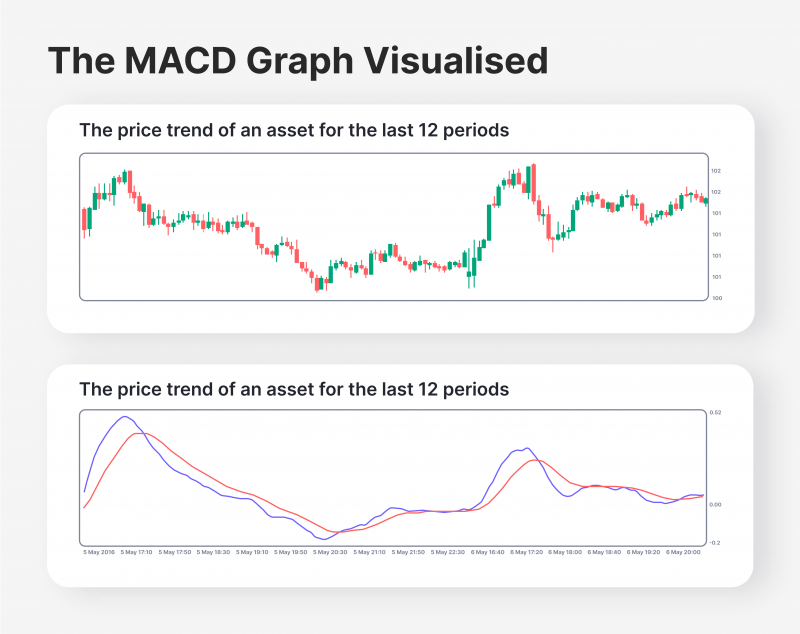
The MACD indicator is yet another globally utilised trend and momentum indicator, simplifying the price movement analysis. The MACD formula is a subset of moving average indicators that measure asset opening and closing price movements in different timeframes and with varying levels of complexity. There are three major variations for moving averages – Simple Moving Average (SMA), Exponential Moving Average (EMA), and Weighted Moving Average (WMA). Each of them is used to conduct different types of moving average analysis. The MACD indicator utilises the EMA for its calculations.
But what does the MACD measure? It identifies the relationship between two EMAs related to a particular tradable asset. The EMA itself is an exponential moving average for tradable assets. The EMA formula is similar to the simple moving average but emphasises the recent price changes in its calculations. The MACD formula requires two distinct EMAs to be calculated – the 26-period EMA and the 12-period one. After that, the MACD model subtracts the 26-period line trend from the 12-period EMA.
As a result, traders can measure the recent performance of a particular asset compared to its long-term empirical performance in the past. Wherever the MACD indicator becomes pessimistic alongside the graph, it signals a downward trend for a specific asset. Conversely, the positive MACD implies that the asset prices will likely increase.
As outlined above, the MACD indicator is highly functional and practical but best utilised with other indicators. While the MACD graph showcases dependable information that the asset is entering a positive or negative trend, numerous factors could keep the asset from continuing the forecasted trend. Thus, it is advisable to combine the MACD with the BB indicator to maximise the chances of forecasting the right trend.
#3 – The Relative Strength Index (RSI) Indicator
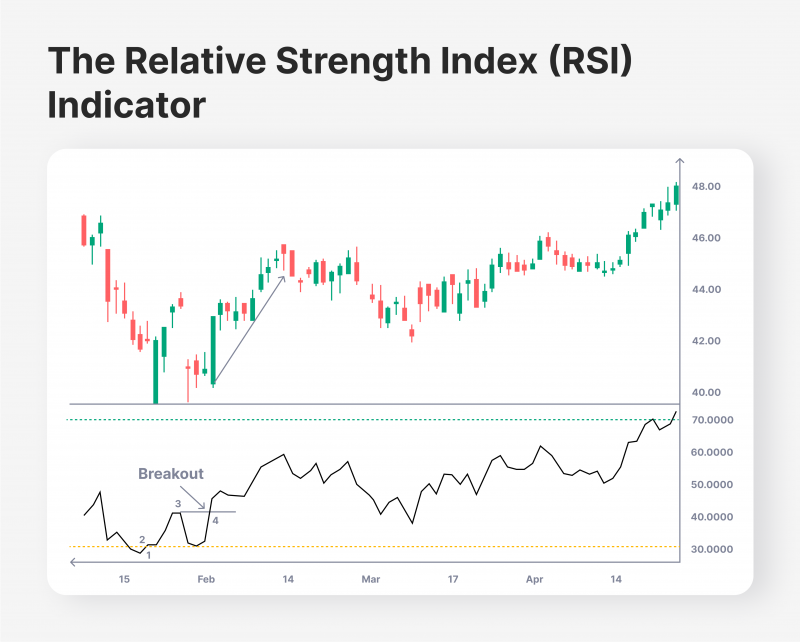
The RSI indicator is quite similar to the MACD, as it also calculates the average price of an asset over some time to identify potential trading opportunities. However, the RSI calculation is considerably different from the MACD model. The RSI indicator calculates the recent price momentum swings in the last 14 periods for a particular asset. RSI is calculated by dividing the last 14-period gains by the respective 14-period losses. As a result, investors receive a clear picture of the recent trading momentum for the asset at hand.
The RSI indicator formula yields a 0 to 100 ratio. If the RSI ratio is above 70, the underlying asset is overbought in the last 14 periods. Thus, it might be a good idea to start selling the asset shortly, as the market is bound to correct the excessive purchasing trend. Conversely, an RSI indicator below 30 signals that the asset has been oversold in recent periods. Therefore, it might be time to consider purchasing this asset while the value is relatively low.
While the RSI is another effective indicator, it can be misleading when utilised separately. After all, assets might be overbought or oversold for a good reason, and the RSI indicator alone is not enough evidence to counter the market momentum. Thus, it is an excellent strategy to combine the RSI with the MACD model and compare the findings from the two indicators.
#4 – The On Balance Volume (OBV) Indicator
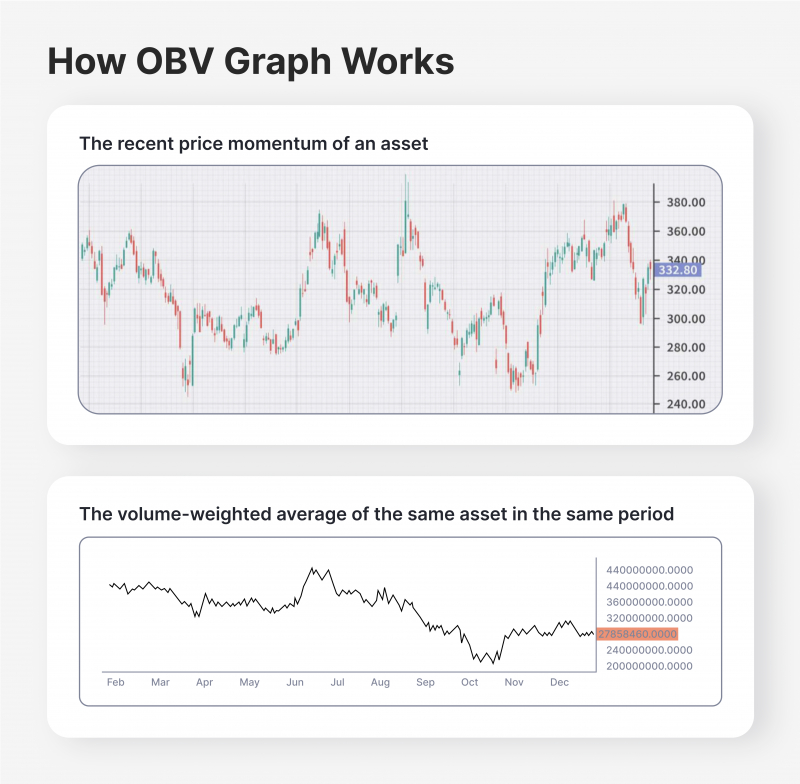
While the price swings for tradable assets can be measured and analysed in detail, there is one variable that traders should carefully consider – the volume of the recent buying or selling trends. The OBV indicator shows the volume of trades behind the pricing trends for tradable assets. The OBV formula achieves this by presenting a graph with the volume-weighted average price. Thus, with the OBV graphs, traders are able to understand the magnitude of the asset price momentum.
The OBV indicator is essential for traders who wish to thoroughly analyse a particular asset, as it visualises the volume of movements in the market. With the OBV indicator, it will be much easier to identify if the asset price is moving organically or if it is manipulated by the market speculators or dominant trading entities. Thus, employing the OBV indicator to understand the overall scope of asset price changes and avoid making hasty decisions is essential. While there are other options, the OBV formula is one of the most accurate volume indicators available.
#5 – Parabolic SAR (PSAR) Indicator
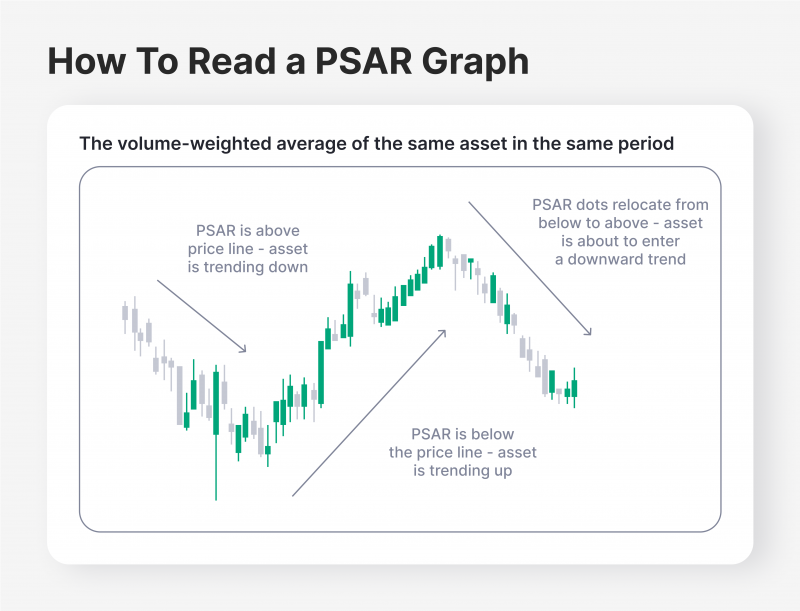
Finally, the PSAR indicator is another excellent measurement tool to identify tradable assets’ potential support and resistance levels. While the calculation of the PSAR indicator is highly complex and requires deep mathematical knowledge, it produces a simple and intuitive graph that indicates potential momentum swings for tradable assets.
The PSAR indicator creates a dotted line that follows the asset price trend throughout its price changes. If the dotted line is placed below the asset price trend, it showcases the potential upward momentum in the asset price. Conversely, if the PSAR lines are dotted above the asset price, it indicates a possible price drop is expected in the near future.
However, the biggest application of the PSAR indicator is in its reversal points. When the asset enters a trend reversal scenario, the PSAR dotted lines tend to change their placement in relation to the price movement. When the dotted lines go from the top to the bottom of the graph, this indicates a major shift in the asset price trend, giving traders the opportunity to reverse their investing positions accordingly. However, it is crucial to utilise the PSAR indicator in combination with other price analysis tools to double-check the potential price reversal.
Final Takeaways
Trend trading has become a go-to strategy for numerous investors worldwide, as it minimises the degree of uncertainty. With appropriate knowledge, expertise and practical experience, traders can utilise trend indicators to derive accurate pricing forecasts. Naturally, the trend indicators will not always predict the price momentum flawlessly, and the traders should account for the factor of unpredictability.
Despite their occasional inconsistencies and miscalculations, trend indicators have a proven track record of success. With enough diversification and careful strategies, traders will be able to reap significant profits from this strategy in both the short and long terms.
FAQ
How do intelligent trend indicators help me trade more confidently?
Intelligent trend indicators can simplify complex market data, making trend following indicators easier to interpret so you can adjust strategies quickly.
Why are trend following indicators useful for beginners?
Trend following indicators offer clear insights into price momentum, helping newcomers avoid guesswork and embrace a more systematic approach.
Can using an intelligent trend indicator boost my long-term gains?
By relying on intelligent trend indicator analysis, you can spot potential shifts early, improving your timing and potentially enhancing overall returns.
Recommended articles
By clicking “Subscribe”, you agree to the Privacy Policy. The information you provide will not be disclosed or shared with others.
Our team will present the solution, demonstrate demo-cases, and provide a commercial offer


