What is the Moving Average (MA) Indicator?

When investing in financial markets, there are numerous techniques you can use to increase your chances of success and make informed decisions. This requires applying different tools on price charts to understand market movements affecting your orders.
The moving average is one way to improve your price analysis. It uses historical data to assess current trends and predict future projections.
It is one of the most popular indicators, with multiple variations to optimise its usage and implementation. So, what is moving average? How can you use it? Let’s explain.
Key Takeaways
- The moving average is a technical indicator to predict price directions and confirm trend projections.
- EMA, SMA, VWMA and SMMA are variations of the moving average used for different purposes (long and short-term trading).
- The MA indicator is widely found on most trading platforms and usually does not require premium payment.
- Experienced traders combine the MA with other indicators, such as the Bollinger bands and the RSI, to improve their analysis and predictions.
Understanding Moving Averages
The moving average (MA) is a technical indicator that uses historical price data to generate general conclusions about current performance and future directions.
Traders can execute it with different timelines for different forecasts. For example, the 200-day moving average calculates the closing prices of the past 200 days and compares the resulting average with the current market value.
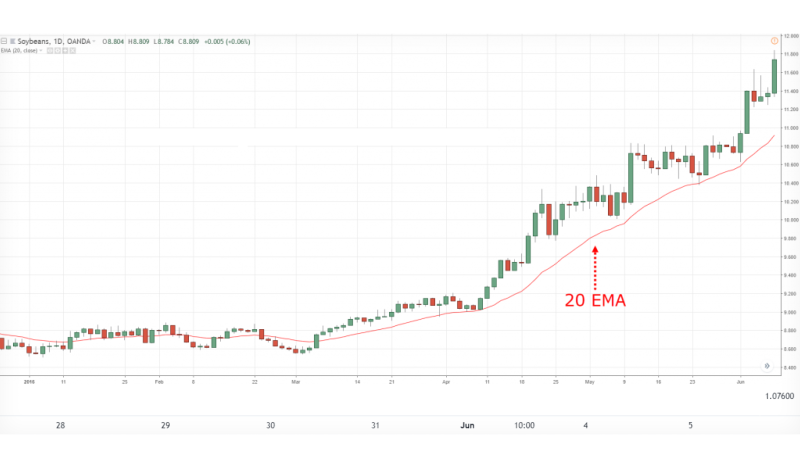
The more days there are, the longer the study period and the more results lag because of the complex data required. For example, short periods, such as a 20- or 50-day moving average, are used for short-term predictions, which suits spot or daily stock traders.
Moving Average on Trading Charts
The moving average model is a trend-following measure that calculates the average value of previous closing prices and draws a moving line across the price chart.
You can use a single MA indicator to compare it with the current price and determine trend directions.
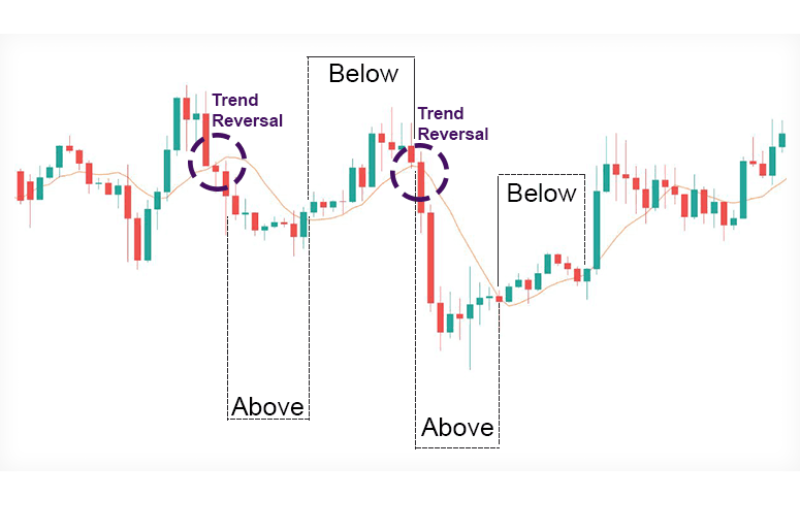
As a rule of thumb, if the MA is under the price line and heading upward, it is more likely to push for a bullish sentiment. On the other hand, if the indicator line is above the price and pointing downward, it suggests a bearish movement.
Alternatively, you can use two MA indicators of different timelines and compare their movements against the price line to determine support and resistance levels and make the correct market entry.
Types of Moving Averages
The moving average is a diverse and valuable indicator to add to your trading charts and technical analysis. There are multiple MA variations that you can apply to improve your predictions.
Simple Moving Average
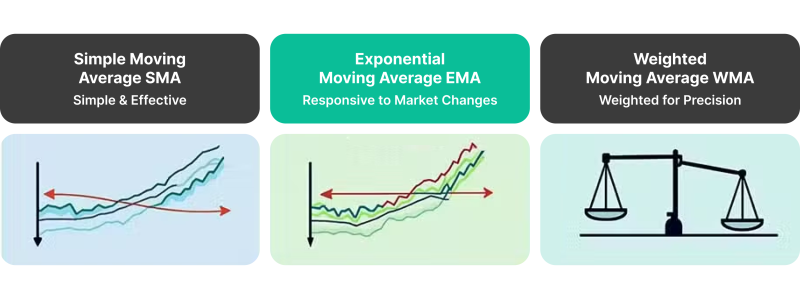
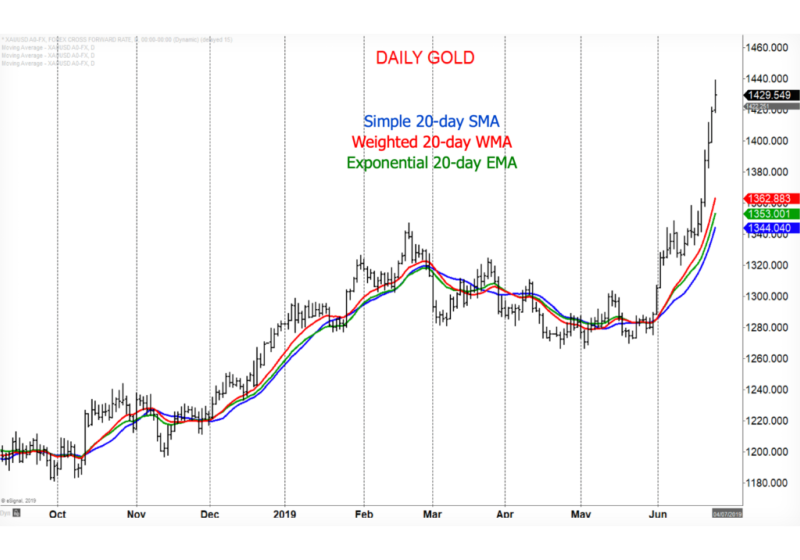
SMA calculates the average prices for a certain period and evenly weighs each data point for comparable price information. It is a commonly used indicator focusing on the bigger picture and long-term analysis while filtering out temporary price swings.
It is popular for long-term trading and position investing strategy, assisting in finding crucial market points like support and resistance.
Pros: Straightforward calculation and interpretation and stable in volatile markets.
Cons: The lagging indicator is slow to react to price changes and is less effective for short-term trading.
Exponential Moving Average
EMA places greater weight on recent prices, making it more responsive to relevant market movements than the SMA.
It emphasises the latest changes and fluctuations to understand current sentiment, making It widely used by short-term and intraday traders to identify trends, reversals, and momentum shifts.
The exponential MA is particularly effective in dynamic or fast-moving markets. It allows traders to spot opportunities and confirm trends much faster.
Pros: Quick to react to price changes, ideal for volatile and short-term markets.
Explore Deeper Industry Insights
Learn from experts shaping the future of financial services — get the latest strategies and trends.
Cons: Less reliable during unstable markets and for long-term trend analysis.
Volume Weighted Moving Average
The volume-weighted average incorporates trading volume into its calculation, assigning more importance to price levels with higher activity. Inspecting the activity levels is typically useful for validating price movements.
This weighted moving average provides a more accurate picture of price trends driven by significant participation. It is a valuable tool for assessing momentum, overbuying, overselling, and high-volume periods.
Pros: Reflects realistic market sentiment and confirms price trends backed by volume levels.
Cons: Complex to calculate and less effective in stagnant or low-volume markets.
Smoothed Moving Average
SMMA includes all past price data instead of selected timelines, weighting older data points less while smoothing out short-term volatility. This approach reduces market noise and suits long-term trend analysis.
The smoothed moving average responds gradually to price changes, making it ideal for identifying long-term investing opportunities rather than short-term action.
Pros: Reliable in identifying long-term trading as it minimises random price fluctuations.
Cons: Slowly reacts to sudden changes and is less effective for high-frequency trading strategies.
The Triangular Moving Average (TMA), Hull Moving Average (HMA), Adaptive Moving Average (AMA), and Kaufman Adaptive Moving Average (KAMA) are other variations suited for different short-, medium–, and long-term trading approaches.
How to Calculate Moving Average?
The moving average formula can be calculated in different ways based on its type—SMA, EMA, VWMA, etc. Generally, it involves past days’ closing prices, division by the number of days with variants, and weighing methods to control data relevance.
The SMA is calculated by summing the closing prices over the chosen period and dividing by the number of data points. For example, the simple moving average formula for a 50-day indicator is as follows:
SMA =sum of closing prices (50 days)/50
The EMA is calculated slightly differently, giving more weight to recent prices to make it more responsive to changes in the following way:
EMA=(Price Today×Multiplier)+(Previous EMA×(1−Multiplier))
Where the Multiplier = 2/period +1, the “Previous EMA” = SMA.
The VWMA is more complex. It uses a straightforward formula, but the steps are longer because of the weight factor.
VWMA = ∑(Price×Volume)/∑(Volume)
The computation requires finding and calculating the above-mentioned formula for each day in the selected interval. Therefore, using a moving average calculator or spreadsheet is more efficient.
How to Use The MA Indicator?
Luckily, you do not need to manually calculate the moving average formula when trading or analysing chart patterns. Most trading systems integrate advanced technologies to compute and represent this indicator, which many investors use for the following purposes.
Trend Confirmation
The moving average is essential for identifying and verifying market trends using smoothing techniques. When you choose the timeline, the MA line will be drawn on the chart, which can be interpreted as follows:
- If the price remains above the MA, it suggests a continuous uptrend, signalling buying opportunities.
- If the price moves below the MA, it suggests a downward trend, signalling selling opportunities.
However, it is vital to examine the end of the MA line and its divergence from the market price. The MA indicator’s pointy tail can suggest a future direction, while the distance from the market price indicates a trend’s strength and sustainability.
Locating Support and Resistance
The behaviour of the moving average line in relation to the price can signal possible market changes and entry/exit zones.
- In an uptrend, the price may test the MA as support, bouncing back upwards as more buyers join the trend.
- In a downtrend, the MA can serve as resistance, where prices struggle to break through as selling pressures prevail.
Traders can use these levels to set and update stop-loss limits and optimise their market entry/exit time.
Analysing Crossovers
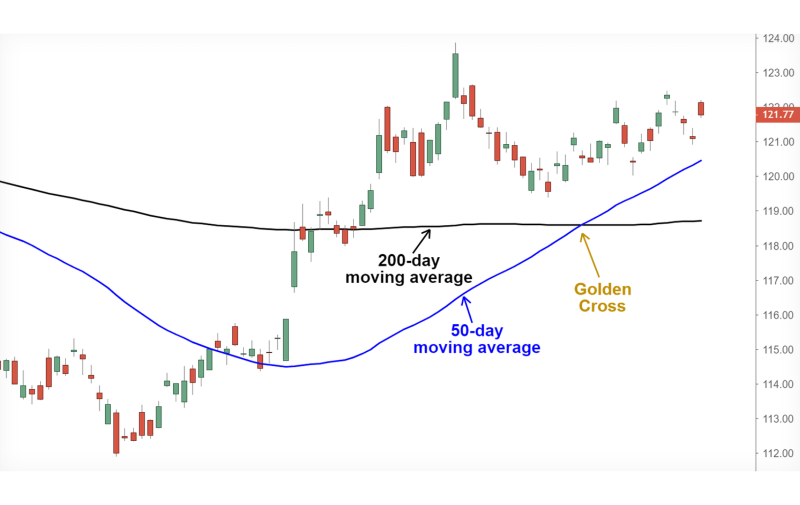
The interaction and crossovers between price and MA lines send crucial signals that trigger buying and selling activities. This technique uses two moving indicator timelines, short and long-term lines.
- When the short-term MA crosses above the long-term MA, it signals a potential upward trend. (Golden Cross).
- When the short-term MA crosses below the long-term MA, it signals a potential downward trend.
This strategy is popular for spotting momentum shifts and trend reversals. It primarily uses the EMA indicator to track recent price changes and drive short-term market orders.
Indicators to Use With The Moving Average Model
Moving averages are highly dynamic and compatible with different trading styles and systems. They can be combined with other indicators to optimise reading and analysis. Here are five indicators you can combine with the MA.
Relative Strength Index
The RSI measures the price momentum, helping find overbought or oversold conditions and driving entry and exit decisions.
When combining the moving average with the relative strength index, you can verify trend direction and potential reversals. For example, if the RSI aligns with a price crossing the MA, it enhances confidence in the signal for entering or exiting trades.
Bollinger Bands
The Bollinger bands draw upper and lower lines around the market price to represent trading volume and overbuying/overselling activities. The band expands and contracts alongside the market action.
When combined with MAs, you can identify potential reversal or bounce points where the price is likely to change direction and make the right investing decisions.
Volume Indicators
Volume indicators like On-Balance-Volume (OBV) assess trading activity and confirm price trends. Used with moving averages, you can validate breakouts or trend continuations by checking if volume aligns with price movement, which helps optimise trading signals in volatile markets.
Stochastic Oscillator
The Stochastic Oscillator measures momentum and compares closing prices to a selected timeline, providing accurate trend verification and prediction.
When you combine it with the MA, you can find potential turning points at overbought/oversold levels and generate trend direction signals.
Fibonacci Retracement
Fibonacci retracement levels pinpoint key support and resistance zones derived from the Fibonacci sequence. These are 23.6%, 38.2%, 50%, 61.8%, and 100%, used in technical analysis to identify potential support and resistance areas.
When combined with MAs, these levels provide strong confluence areas for potential reversals or breakout points, enhancing accuracy in determining entry and exit positions.
Discover the Tools That Power 500+ Brokerages
Explore our complete ecosystem — from liquidity to CRM to trading infrastructure.
Advantages and Disadvantages
The moving average indicator is popular for a reason. It is very easy to use and understand and can be implemented in different scenarios with its multiple variations. However, there are a few shortcomings that you must consider. Let’s review the advantages and disadvantages.
Pros
- Trend identification: Smoothens price data, making it easier to analyse and confirm the overall market direction.
- Support and resistance: Helps find optimum market entry and exit points, especially in trending markets.
- Versatility: MAs can be adapted to short-term and long-term trading strategies by adjusting timeframes and types.
- Straightforward use: MAs are simple to calculate and interpret, making them ideal for beginners and experienced traders.
- Signal generation: You can receive actionable trading signals through line crossovers or price interactions with the MA.
- Highly available: the moving average is found on most trading platforms for free, unlike custom indicators that require premium.
Cons
- Lagging update: The indicator relies on historical data, making it slow to respond to recent price movements.
- Ineffectiveness in sideways: Its lagging nature provides little usage in choppy markets, possibly providing false signals.
- Volatility sensitivity: The moving indicator can generate unreliable signals during periods of high market fluctuation.
- Parameter dependence: Traders must carefully tune timelines, variables and other inputs to match the market’s characteristics.
- Limited to trends: Reacts to current momentum rather than forecasting sudden price changes or reversals.
How to Apply MA Indicators?
Unlike custom indicators, which require additional payment, MA is widely available in different variations (SMA, EMA, and VWMA) on most trading platforms, such as TradingView, MetaTrader, and cTrader.
To observe trends, crossovers, or support/resistance levels, you only need to find the indicators tab, select the desired moving average and timeframe, and overlay the indicator on a price chart.
In MetaTrader
To use moving averages in MetaTrader, open the chart of your desired asset and select Insert > Indicators > Trend > Moving Average.
Configure the parameters, choose the period, the MA type (SMA, EMA, etc.), and the application method (close, open, high, or low). Once applied, the indicator will appear on the chart and track price movements.
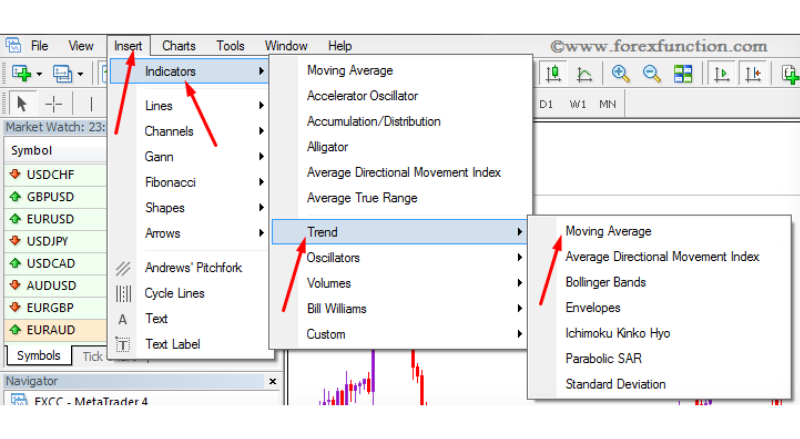
Add multiple MAs with different periods (50-day- and 200-day) for strategies like crossovers. MetaTrader also allows you to combine MAs with other indicators through the Navigator panel for advanced techniques, enhancing your technical analysis and decision-making process.
In cTrader
To use the moving average in cTrader, right-click the chart and select Indicators > Trend > Moving Average. Then, set the timeframe, MA type (SMA, EMA, etc.), and method (close, open, etc.) to customise the indicator for your trading strategy.
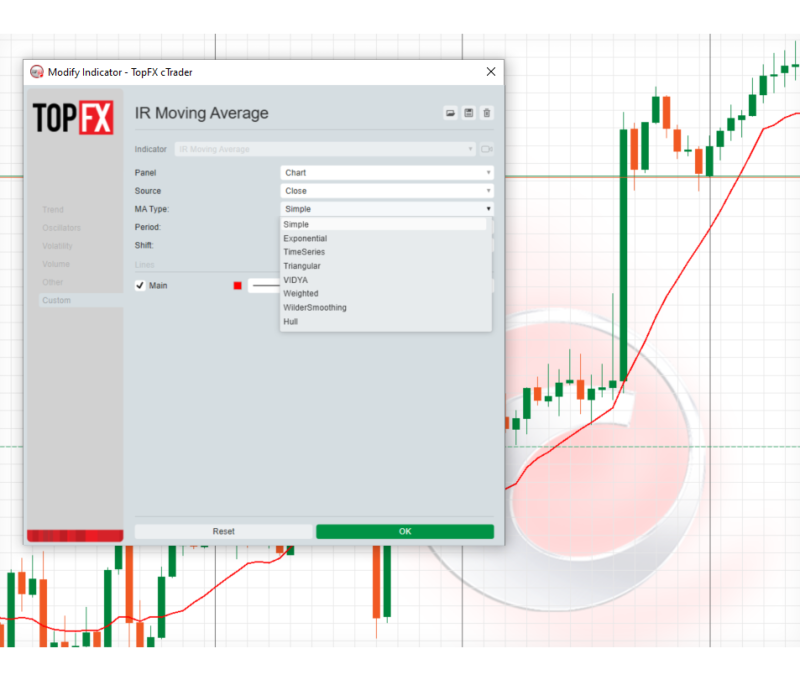
The MA line will be drawn on the chart, smoothing price data and highlighting trends. You can add multiple MAs with different periods to use a crossover strategy.
You can also pair the MA with other cTrader indicators, such as the RSI or Bollinger Bands, for deeper insights, making it a flexible tool for making informed trading decisions.
Conclusion
The moving average is one of the most commonly used technical indicators in financial trading. Beginners and experienced investors apply the MA with different types to improve price analysis, confirm trends and enter/leave the market at the right time.
It is widely used to predict future price movements, locate support and resistance levels, and identify trend projections. Traders can combine the MA with other indicators, such as Bollinger bands, RSI, or Fibonacci retracement, to optimise chart analysis and verify market action.
It is widely used in most trading software and can be implemented and configured easily. However, during choppy markets and high volatility, you must consider its lagging nature and combine it with other tools.
FAQ
Which moving average is the best?
It depends on the trading approach. The EMA is suitable for short-term trading due to its quick responsiveness, while the SMA is better for long-term strategies because it ignores temporary market noise.
What do moving averages tell you?
The MA helps find market trends and predict future price movements. Its different variations can be used and combined to discover potential support and resistance levels and reversals through crossovers.
How to analyse prices using the moving average?
Observe the indicator line’s interaction with the market price. Monitor crossovers between short- and long-term moving averages that signal potential reversals.
How to use the moving average?
Apply the MA on the trading platform’s chart, set the timeline, choose the type based on your trading goals, and combine it with indicators like RSI or MACD to confirm the signals.


