Bullish Candlestick Patterns for Beginners – Top 10

Professional traders utilise various tools to improve their analysis and predict market movements more accurately. Whether you actively invest in stocks and currencies or just want to keep up with ongoing trends, finding the right chart option is vital to increasing your chances.
The candlestick chart is one of the most popular layouts for tracking price action and fluctuations. It is easy to read, understand and identify upward and downward movements.
Locating bullish candlestick patterns allows you to enter the market at the right time and earn as the price grows. How do you use these charts? Let’s discuss.
Key Takeaways
- Candlesticks are popular chart options that indicate the daily price changes and high/low limits during the day.
- A combination of two or three candles formulates patterns that suggest specific market movements.
- Most bullish chart patterns reflect the buying and selling activities, leading to bullish and bearish sentiments.
- Chart patterns can be combined with trading strategies and technical indicators to optimise price analysis and prediction.
Popular Chart Types Investors Use
Line, bar and candlestick are popular charts that investors use. Each serves a different purpose and provides a distinct overview and complexity.
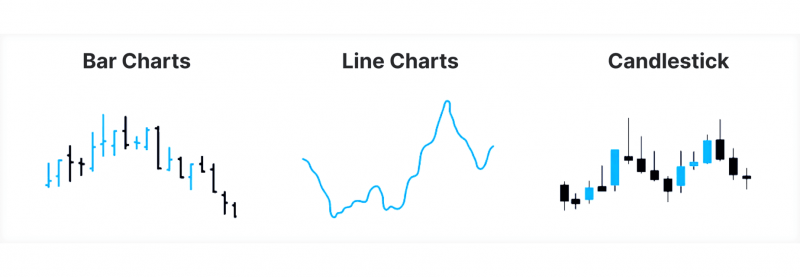
Lines: The simplest chart type, tracking the asset’s price during a trading session and reflecting it on the horizontal axis.
Bars: Reflects the price changes on vertical bars with hands pointing left and right, indicating a session closing and opening.
Candlesticks: More detailed charts demonstrating intra-day high and low ranges and the opening-closing price interval.
Understanding Bullish Candlestick Patterns
The price chart is what you see on your trading software, indicating price movements and traders’ activities. These interactions are expressed in different layouts.
Trading candlestick patterns offer deeper insights into price changes in one day, a week or a month, based on the selected timeline.
Bullish and bearish candlestick patterns are chart formations suggesting a possible price increase and decrease, respectively. Traders look at small timestamps or part of the chart to find a pattern rather than monitoring the entire session.
How to Read Candlestick Patterns?
Each candle is made of a “body” and “wicks”.
- The body is a solid block that represents changes between the opening and closing prices.
- The wicks are thin lines extending above and below the body, reflecting the price highs and lows during intraday fluctuations.
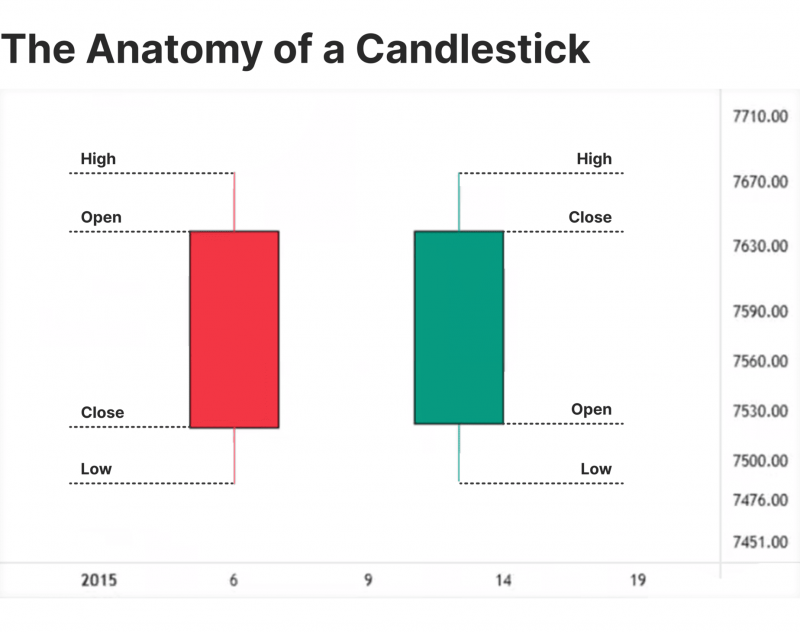
Since candlesticks offer a more detailed display than line and bar charts, their alignments are more crucial when reading market movements.
Candles’ bodies have different sizes, representing the trading volume and daily price change. Similarly, wicks may branch out far from the body and close it, reflecting the intra-session fluctuations.
For example, when three candlesticks are presented on the chart with large bodies, it means that buying pressures are more likely to prevail. Therefore, locating and understanding candles’ sequences, ranges, and sizes is necessary.
However, there are three considerations that you must account for:
- Patterns are not always guaranteed to work, as some anomalies happen and unpredictable market events happen.
- Understanding market conditions and context is crucial to eliminate economic pressures and sudden reversals.
- Combine other indicators to verify trends and check volumes to affirm a chart pattern.
Examples of Bullish Candlestick Patterns
Bullish reversal candlestick patterns are common to locate points where a price dip bounces and creates an upward trend. The three white soldiers is another lineup that shows an inflow of bulls, adding buying pressure and suggesting a continuous trend in the same direction.
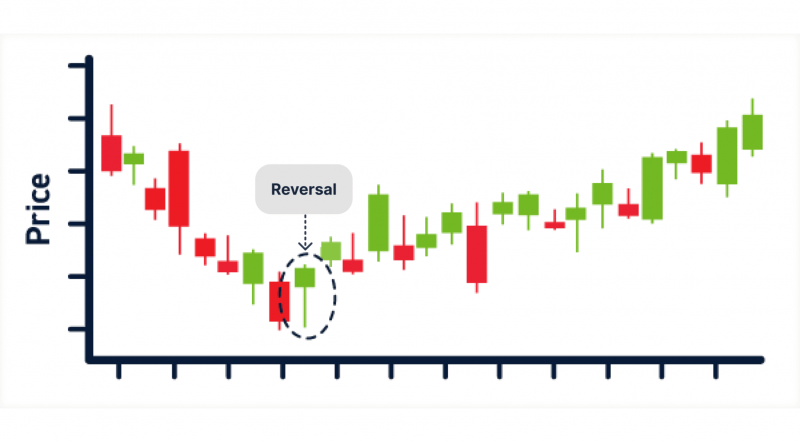
Since chart formations are not fool-proof, knowing how to read candlestick patterns and using them in conjunction with other technical indicators is crucial to reducing risks and improving accuracy.
Trading software offers built-in pattern locators to make the process easier and faster. TradingView has 16 candlestick pattern visualisers to identify price action, while cTrader and MetaTrader offer around 34.
Bullish vs Bearish Patterns
When the bullish pattern indicates a price increase, bearish chart formations refer to possible price dips. Additionally, bearish reversal pattern layouts may have different formations as economic factors are different.
During market stagnations, you are more likely to witness negative price changes indicated with a red candlestick body. However, fluctuations happen, and you must verify each pattern before implementing or changing your trading strategy.
Have a Question About Your Brokerage Setup?
Our team is here to guide you — whether you're starting out or expanding.
Top 10 Bullish Candlestick Patterns
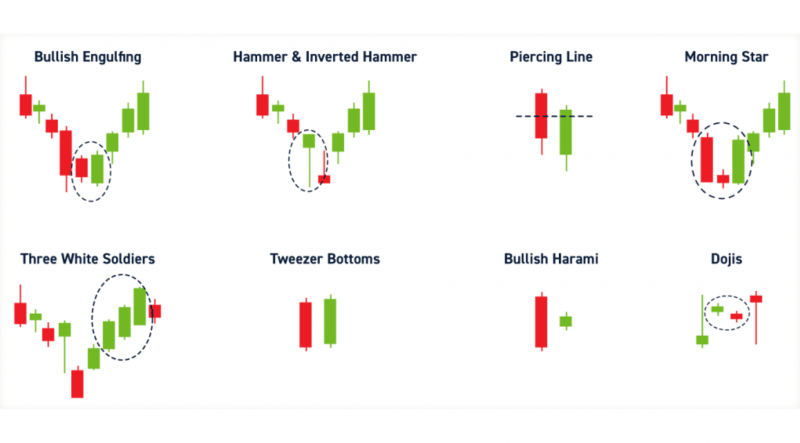
Let’s discuss some strong bullish candlestick patterns you can apply to your trading strategy. You might find up to 50 bullish patterns. However, the best 10 candlestick charts suggest a proper time to place your long position.
1. Bullish Engulfing
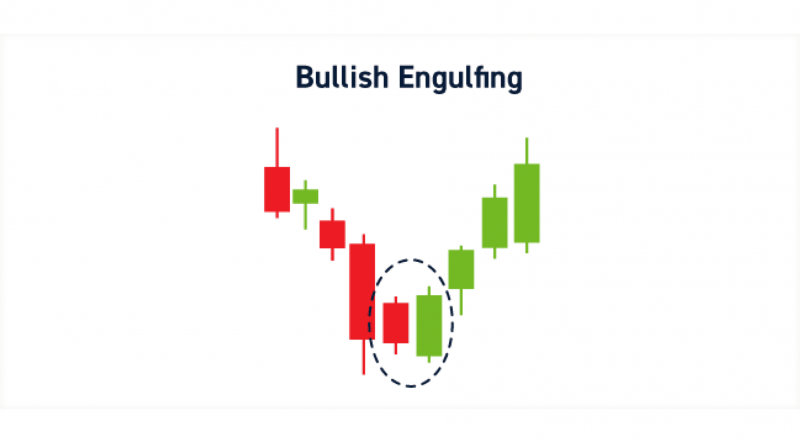
When a bearish candlestick (in red) is followed by a larger bullish candlestick (in green), it represents a bullish engulfing candlestick pattern. It is important to note that the green candle’s body must “engulf” the red one before it, indicating the end of a downtrend and the start of a price climb.
Engulfings usually appear near critical trading zones like support prices, trend lines or demand zones. The reason behind this lineup is higher traders’ inflow around the support level, increasing the buying pressure and affecting the overall market sentiment.
However, you must verify the trend using the trading volume to ensure that bulls outperform bears and initiate an upward trend that you can capitalise on.
2. Hammer and Inverted Hammer
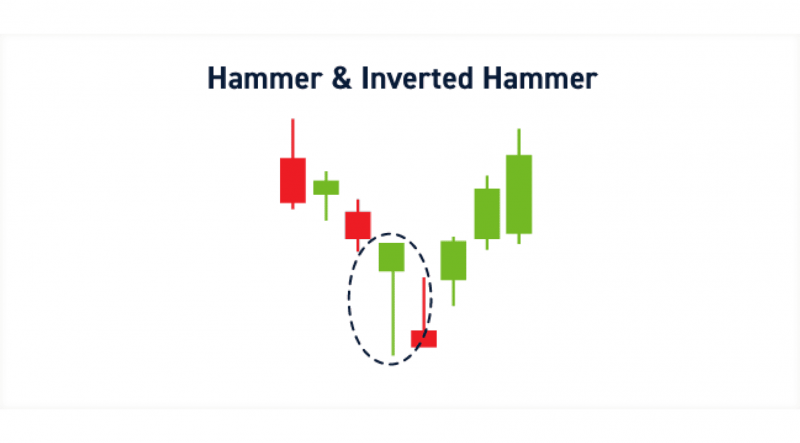
The hammer and inverted hammer is a combination of two hammers in opposite positions. At the end of the downward trend, a green candle formed like a hammer is followed by an inverted hammer in red.
Both hammers have a unique structure, with a small body representing a narrow open-close price diversion and long-extending wicks suggesting buying and selling pressures during the day.
The first hammer’s body indicates a higher closing price than the opening, while the long lower wick refers to the price drop rejection. As such, bears try to drop the price by selling their positions, but the bulls reject this change by adding buying pressure to keep the price higher.
The inverted hammer has a lower body and a long upper wich, which represents the increasing buying power as sellers give up. At this point, bears reduce their selling activities with prevailing buyers who push the price higher near the previous day’s closure.
3. Morning Star
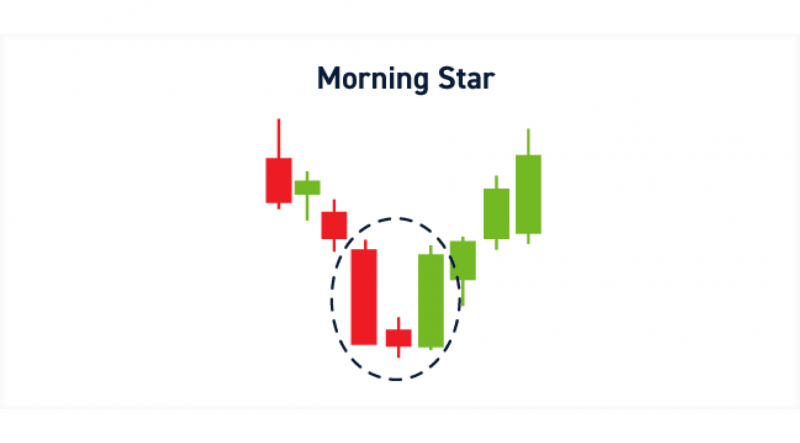
The morning star is one of the most popular bullish reversal patterns that involves three candles representing a market sentiment transition.
- The first candle is usually a large downward candlestick with a bigger body than wicks.
- The second candle is medium or small size and is usually bearish.
- The third bearish candle is larger than the previous candle.
This sequence demonstrates the decreasing selling pressure and the inflow of new buyers, adding buying pressure and pushing the prices upwards.
4. Three White Soldiers
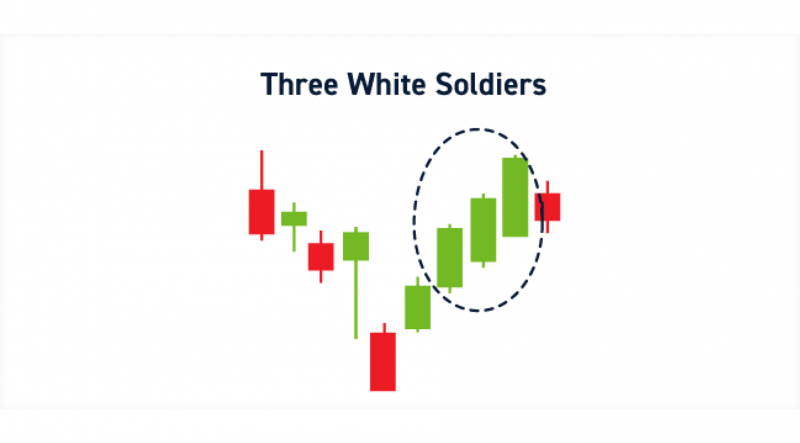
The “Three White Soldiers” is a simple alignment of three consecutive bullish candles with significant bodies and small wicks extending up and down.
The reason for this formation is the high influx of buyers, executing long orders and triggering a bullish market.
The candlesticks in this pattern are usually bigger than their preceding ones, suggesting a growing positive trend as the price responds to growing buying pressures.
You can confirm this trend by combining it with other trading indicators like the Fibonacci retracement or the trend lines. It is essential to look at the trading volume as it must be increasing with each trading session.
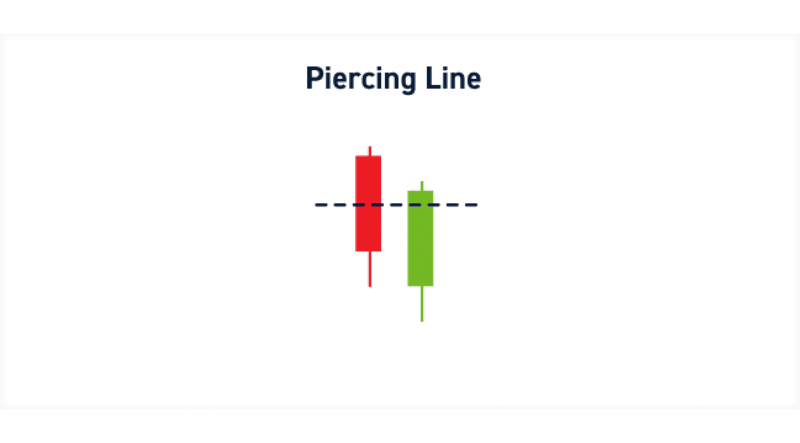
5. Piercing Line
The piercing line pattern consists of two candles. The first is a bearish large-sized candle, followed by a bullish one. In order for this pattern to emerge, the bullish candle must meet the following conditions:
- The opening price must start below the bottom of the previous one.
- The closing price must be above the midpoint of the first candle.
It is also essential to verify the size of each candle, as bodies must be significant to confirm a new trend. If this pattern appears near key trading zones, the probability of price reversals increases.
6. Tweezer Bottoms
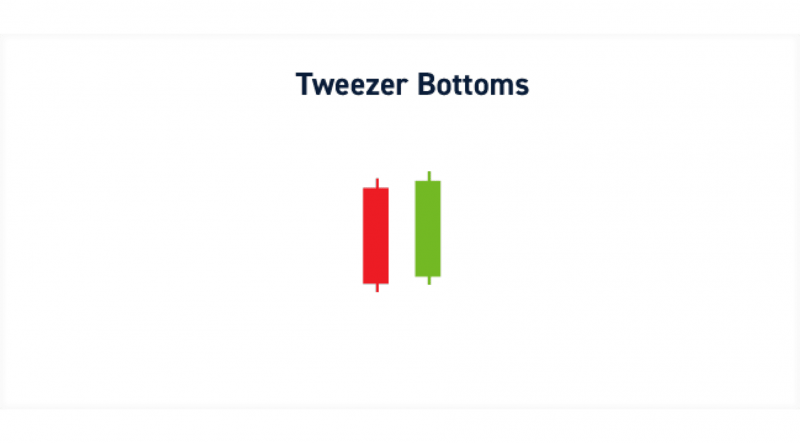
The tweezer bottoms appear at the end of a downward trend, consisting of two large candles: a bearish candlestick followed by a bullish one. It is a commonly used trading signal across various markets and assets, indicating a switch between selling and buying pressures.
Both candles must be approximately the same size. The opening price of the bullish trend must start at the closing price of the downward trend, and the closing price of the bullish must be at the same level or slightly above the bearish candle.
The logic behind this pattern is that the matching pressures on both sides of the market. The selling pressure in the first candle is matched with a similar or more buying pressure in the second candle, triggering a price climb.
7. Bullish Harami
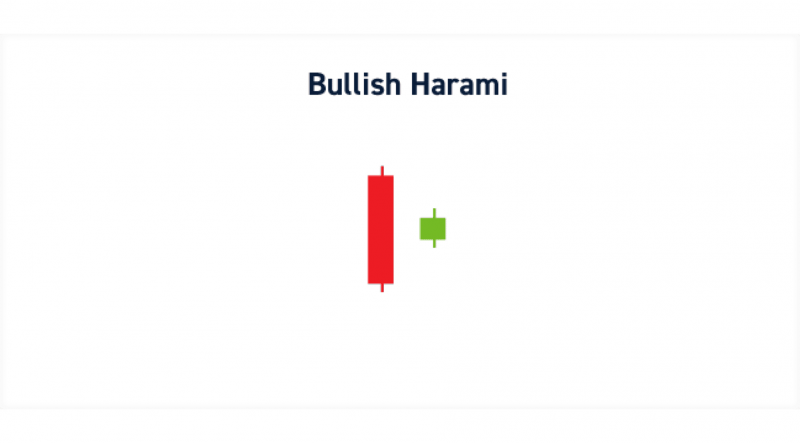
The bullish Harami candlestick pattern is similar to the bullish engulfing. However, it is a reversed one. This time, the bearish candle is significantly larger than the bullish one, which must be small enough to fit inside the previous candle pattern, including its wicks and body.
This alignment indicates market confusion, as sellers are slowly giving up because they can no longer hold their positions. This leads to a bullish reversal pattern, with buyers prevailing and initiating a bullish run.
However, confirming the trend using oscillators or other indicators is important because this small change could be a part of regular fluctuations before returning to the bearish run.
8. Dojis
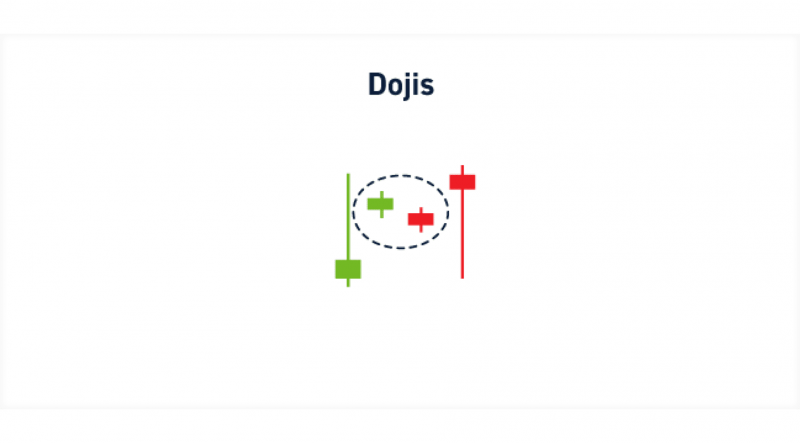
Candlestick Dojis are price conditions that refer to indecisive markets. In such situations, neither bulls nor bears have an upper hand as both sides fail to maintain their stands.
Dojis are usually straightforward, as they have a unique formation, with the candle’s body being very small or almost non-existent, as well as long-extending wicks on both sides. The tiny bodies mean that the market is opening and closing at almost the same level as neither side is able to maintain their positions.
This indecision can be followed by price reversal if found at the bottom of a downward trend, also known as dragonfly Doji, shaped as a T-shape or a hammer. However, you must confirm the trend using other indicators.
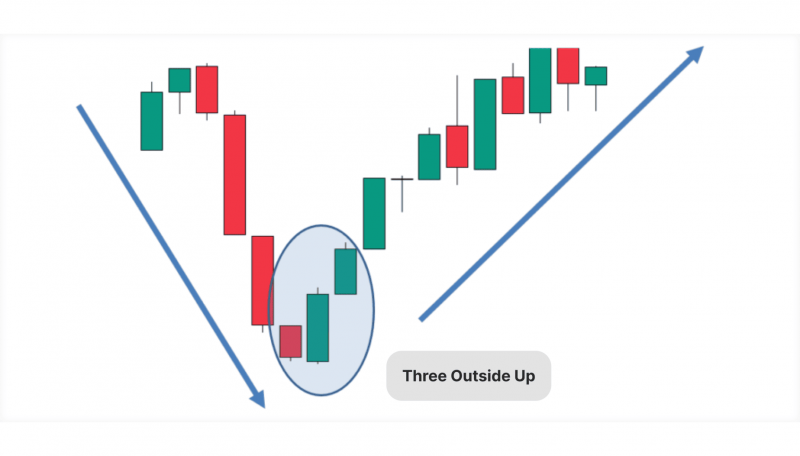
9. Three Outside Up
The “three outside up” pattern consists of three candles and indicates a bullish reversal. These formations are usually found at the bottom of the chart, consisting of a bearish candle followed by two bullish ones.
The first is a small to medium-sized red candle. The second one is a green candle, which is large enough to cover the previous candle entirely with its wicks. The third is also bullish, with a starting price above the previous one and an even higher closing price.
10. Three Inside Up
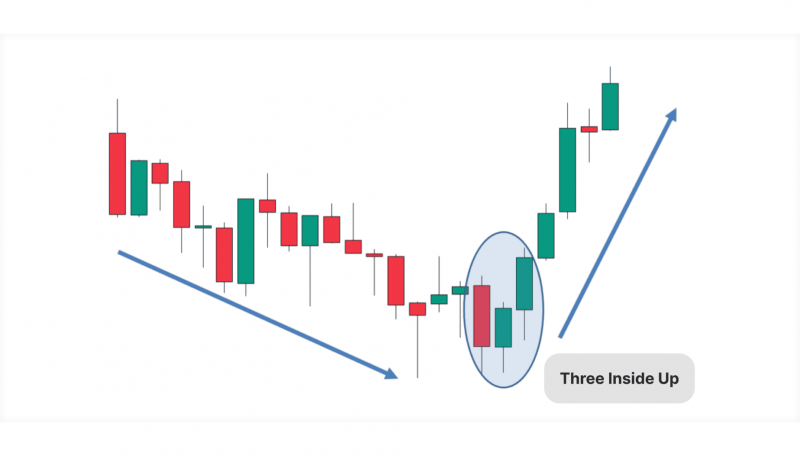
The “three inside up” is similar to the “three outside up” with a twist. The first candle is bearish, indicating the end of the downward market. The second is a small bullish one, marking the beginning of an upward trend. The third candle is also green, with higher starting and closing prices than the previous one.
The second candle is usually tiny enough to fit within the previous one. These layouts are typically found at the bottom of the chart, indicating the decreasing power of sellers as buyers overtake the market sentiment.
How to Trade with Bullish Candlesticks?
You can combine the bullish candlestick patterns cheat sheet with your investment strategies to increase your chances of landing a successful trade. Here are the top trading tactics you can follow.
Breakout Strategy
Bullish candlesticks are valuable for predicting price recovery and rebound at resistance levels, triggering the start of a new trend. Locate the support and resistance zones and wait for a potential breakout when a bullish candlestick pattern is evident.
The engulfing pattern and the bullish Harami are used in conjunction with these strategies to predict and capitalise on price breakouts.
Trend Reversal Strategy
Trend reversals usually happen at the bottom of the chart or at the end of a downward trend. Look for a morning star or three inside/outside ups, suggesting a deteriorating selling pressure and the inflow of buyers.
Discover the Tools That Power 500+ Brokerages
Explore our complete ecosystem — from liquidity to CRM to trading infrastructure.
During these moments, a bearish market is replaced with a bullish momentum. However, use technical indicators to verify this shift and apply stop-loss limits to manage your risks.
Trend-Locating Strategies
Use patterns like the three white soldiers or the hammer to find new price trends and capitalise on these strong movements to realise more gains.
These chart layouts track upward trends, especially when more buyers enter the market or market bulls outperform bears to solidify the bullish sentiment.
Best Assets to Trade With Candlestick Charts
Bullish candlestick charts are used across a broad range of securities and asset classes. Some markets require detailed chart analysis due to their volatility or trend characteristics.
Forex
EUR/USD, GBP/USD, and USD/JPY are the top major currency pairs that can be used with candlestick patterns to locate and confirm trends. The abundance of liquidity, market participants and strong trends make patterns like the bullish or bearish engulfing pattern, hammers and Dojis highly useful in finding the correct market entry.
Moreover, the 24-hour availability of the Forex market provides longer timeline traceability and analytics for more reliable insights.
Crypto
The high volatility of cryptocurrencies makes bullish layouts like the Morning Star pattern and Dojis useful for locating price reversal on time.
Major cryptos like Bitcoin, Ethereum and BNB feature sharp movements and strong trends, especially after breaking news and new blockchain introductions. Therefore, trend-affirming and reversal-tracking patterns and indicators are useful for capitalising on solid price trends.
Stocks
Equities offer moderate price changes and fluctuations during the day with a high trading volume. Therefore, using bullish candlestick patterns helps locate new trends and predict price reversal.
Blu-chip stocks, such as Apple, Amazon and Google, have low volatility due to the massive number of stocks outstanding and shareholders.
However, after economic announcements and major reports, traders tend to speculate about the overall reaction and market sentiment. Therefore, implementing these charts allows you to make the right market entry.
Conclusion
Bullish candlestick patterns are price chart formations that give traders insights into potential price reversals or trends. These layouts consist of two or three bearish and bullish candles indicating upward or downward price trends.
Analysing the direction, size and density of each candle helps locate price action, especially near critical trading zones like support or resistance levels. Most of these changes refer to the buying and selling pressures applied by bulls’ and bears’ activities and how they affect the market price.
FAQ
What is the best candlestick pattern?
Doji and engulfing are popular bullish candlestick pattern forms that indicate a possible price reversal. Doji has multiple variations for different purposes, like the Gravestone, the Dragonfly and the long-legged Doji pattern.
Which bullish pattern is better for intraday trading?
The bullish engulfing pattern is helpful for intraday sessions to find price momentums and capitalise on growing trends. On the other hand, the hammer and inverted hammer candlestick pattern helps identify reversal points.
Who uses candlestick patterns?
Some chart layouts can be challenging to determine, like the bearish Harami and the bullish reversal pattern, due to their complexity and reliance on other market factors. Therefore, professional traders are better qualified to chase these patterns.


