How to Use The Bitcoin Liquidation Heatmap

These liquidation events create a Bitcoin liquidation heatmap, giving investors insights and predictions. For example, one of the latest crypto turmoils saw over $800 million liquidated from BTC positions. Why did this happen? Let’s explain in more detail.
Crypto investors use various tools and charts to make their market decisions, and if you invest in Bitcoin, you might have heard of the latest crypto liquidation that struck the markets and left traders wondering about the future of cryptocurrencies.
So, what is crypto liquidation? How can you use this concept to your benefit?
Key Takeaways
- The Bitcoin liquidation heatmap is a graphical depiction of price areas with high liquidation possibilities.
- The price level with consolidated crypto liquidation reflects the potential and size of liquidations if the price reaches that level.
- The heatmap depiction helps understand potential trends, volatility levels, and market sentiment.
What is Liquidation in Crypto?
Liquidation happens when a trading order is foreclosed due to insufficiency, especially in leveraged market positions that fail to maintain the margin requirements. These events happen due to sudden market shifts, triggering position liquidation to protect brokers and traders from excessive losses.
Let’s take a non-crypto example. If you take a loan and fail to pay your debt back, the lender can acquire the collateral to compensate for losses. However, if the collateral does not suffice, your assets will be liquidated to cover the losses.
This is exactly what liquidation in crypto means. When traders use leverage to trade in the market, they essentially borrow money from the broker, hoping to capture significant gains if the market moves in a particular direction. However, if the market moves sideways, the margin account balance will fall in the negative, and the broker will liquidate the trader’s positions.
Understanding Bitcoin Liquidation Heatmap
The BTC heatmap is the graphical representation of current market leveraged positions and the number of estimated liquidation levels if the market hits a certain price level.
It uses market data from crypto exchanges and brokerage firms to predict the number of open leveraged trades and the liquidation level resulting from foreclosing positions.
The Bitcoin heatmap chart enables traders to understand market trends and draw their predictions on the upcoming coin movements, especially in volatile markets where prices more frequently and speculations affect investors’ sentiment.
Have a Question About Your Brokerage Setup?
Our team is here to guide you — whether you're starting out or expanding.
Interpreting The BTC Liquidation Heatmap
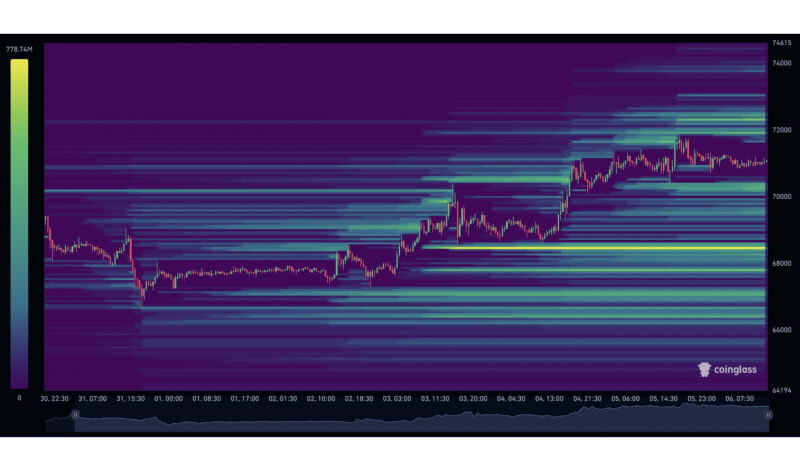
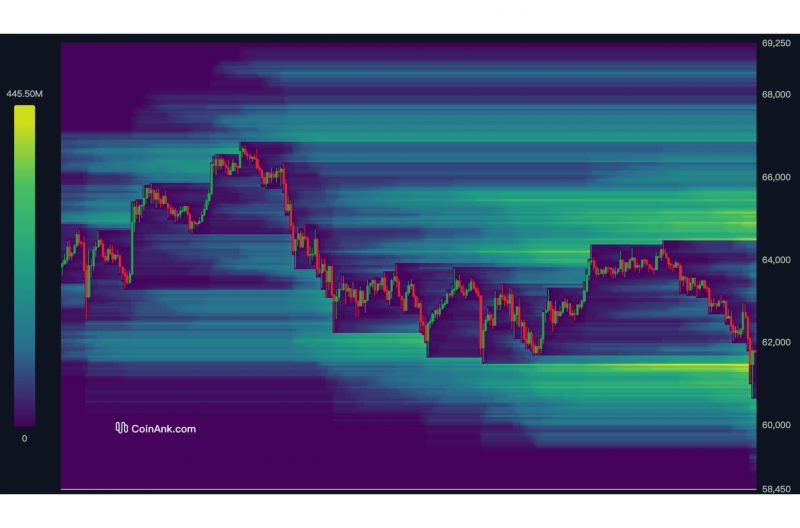
The Bitcoin liquidation heatmap depicts different colours, ranging from blue to yellow, to reflect the intensity and amount of liquidated money.

When a blue colour is assigned to a particular price level, fewer liquidations are estimated, and the impact is minimised. However, in green and yellow areas, crypto liquidations are higher, and the market impact is more significant.
A noticeable Bitcoin sell-off happens when many long orders are leveraged, and the price drops to a given price level, closing positions and dumping cash into the market. Conversely, when many short positions are open, and the price increases unexpectedly to a yellow-assigned level, massive liquidations are more likely to happen, and many positions will be foreclosed.
Many brokers provide investors with liquidation price levels before executing margin trading, giving users an insight into the possible sell-off threshold.
A significant Bitcoin dump can severely impact the market, increasing the cash flow, decreasing the number of overall open positions, and causing higher price volatility.
On 5 April, the Bitcoin market plummeted excessively, dropping from $58,000 to $50,000 in a few hours and liquidating $1 billion in market positions.
Using The Bitcoin Heatmap for Trading Decisions
Increasing liquidation levels and higher price volatility are crucial inputs that can aid the trader in making investing decisions. There are many ways to use the Bitcoin liquidation heatmap to your advantage.
- Magnet zones: Due to market dynamics and supply and demand forces, prices are more likely to gravitate towards areas with increased liquidity zones. When a price level is marked with yellow, the chances are high that the price will reach this mark.
- Identifying support and resistance levels: Crypto whales are more likely to execute large orders in high liquidity levels, causing the price to drop slightly after placing their trades. These dynamics create support and resistance, suggesting areas where traders can enter or exit the market.
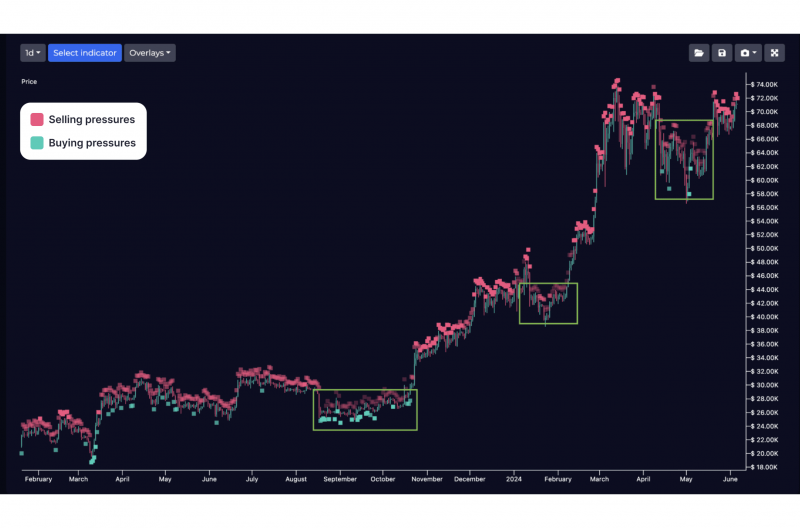
- Identifying buy/sell pressures: the liquidation heatmap helps depict the buying and selling pressures on the chart. Areas with high liquidity are more likely to come with volatile buying and selling pressure.

source: whaleportal.com
The above chart shows how buying and selling pressures increased on both sides of the trade in liquidity-consolidated areas.
Types of Liquidation Event Heatmaps
Investors use different Bitcoin liquidation representations to understand the market impact and the number of estimated closed positions.
Colour-Coded Zones
The classic blue-yellow chart reflects the estimated amount of Bitcoin liquidation when the market price reaches a certain level. This chart enables traders to view the historical liquidation data alongside different price ranges.
Blue areas refer to few liquidations with no market impact, while yellow zones refer to intense liquidation activities. This approach helps make predictions and look at the bigger picture to make informed trading decisions.

Gradient Legend Map
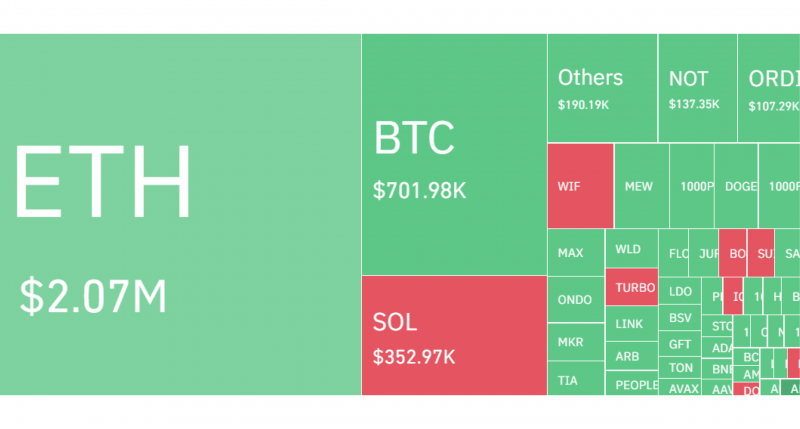
This liquidation map type demonstrates current market conditions and liquidation activities using two colours (green and red) and squares that reflect the event’s magnitude.
The green colour means low liquidation activity, and the red indicates high liquidation and more volatility. This depiction provides a straightforward understanding of the crypto liquidation event. However, it only offers the current view without price-time correlation.

Why Use a Bitcoin Liquidation Heatmap
The crypto liquidation map is a helpful tool, especially when trading with margin accounts and in volatility markets, where prices are sensitive to speculations and can suddenly move sideways. Here’s why you must include the heatmap in your technical analysis toolkit.
Risk Management
The Bitcoin liquidity heatmap gives traders an insight into potential liquidity and price fluctuations. These inputs help investors adjust risk factors, fine-tune stop-loss orders, and revisit their leverage positions.
Discover the Tools That Power 500+ Brokerages
Explore our complete ecosystem — from liquidity to CRM to trading infrastructure.
Many investors minimise trading during high liquidity zones to avoid unwelcome surprises.
Trend Confirmation
Liquidation areas can be used as a complementary tool to trend-tracking indicators. The crypto liquidity heatmap is better used as an additional depiction to find and confirm potential market trends and their impact.
Leveraging a Bitcoin Position
Professional investors and risk-taking traders prefer leveraging their positions, as they follow “high-risk, high-reward” strategies. Therefore, taking a look at the liquidation heatmap for Bitcoin offers better insights into market conditions and areas where positions become highly risky.
Conclusion
The Bitcoin liquidation heatmap became highly popular in the last few weeks as the cryptocurrency market tumbled and millions of Bitcoin sell-offs occurred.
This chart depicts areas where leveraged positions are most likely to get liquidated if the market price hits certain levels. This insight aids decision-making and tightening risk management strategies to avoid significant losses.
FAQ
What’s the value of using a bitcoin liquidation heatmap?
A bitcoin liquidation heatmap pinpoints zones where leveraged trades might break down. By checking the btc liquidation map, you can gauge potential hot spots and fine-tune your strategy.
How can the btc liquidation map help in volatile market conditions?
In turbulent times, the btc liquidation heatmap highlights areas where sudden liquidations occur. Knowing these zones helps you adjust your orders and limit unwanted losses.
Why compare a btc liquidation map with standard price charts?
Standard charts show price action, but a bitcoin liquidation heatmap reveals potential liquidation triggers. Together, they help you anticipate market shifts and strengthen your overall trading approach.


