Relative Volatility Indicator: What Is It, and Why Does It Matter?

In modern financial markets, traders are always on the hunt for better tools to sharpen their decision-making. One such tool that has attained a reputation in recent years is the Relative Volatility Indicator (RVI). It has gained popularity among traders due to its ability to reflect volatility and confirm price trends.
But what exactly is the relative volatility indicator, and why does it matter for traders and investors? Let’s explore the RVI, its calculation, and its practical applications in trading strategies.
Key Takeaways
- The RVI is a powerful technical analysis tool that measures the direction of price volatility in financial markets, ranging from 0 to 100.
- Using the relative volatility index formula, traders can calculate volatility over a specific period.
- While valuable, the RVI is best used as a confirming indicator alongside other technical analysis tools for a more comprehensive trading strategy.
Relative Volatility Index Definition

The Relative Volatility Indicator was developed by Donald Dorsey in 1993 as a variation of the more well-known Relative Strength Index (RSI). While the RSI measures the momentum of price movements, the RVI focuses on fluctuations. It analyses how volatile a market is over a specified period, giving traders a more comprehensive view of high and low prices.
This indicator is especially useful when the market is in oversold conditions or when traders seek to identify the strength of price movements in a trending market.
The RVI compares absolute price changes over a specific period, and the output is a value between 0 and 100. Higher values indicate greater fluctuations, while lower values reflect a more stable market. The RVI is typically used as a confirming indicator alongside other technical analysis tools, such as the Relative Strength Index or moving averages, to generate more accurate trade signals.
The Relative Volatility Indicator Formula
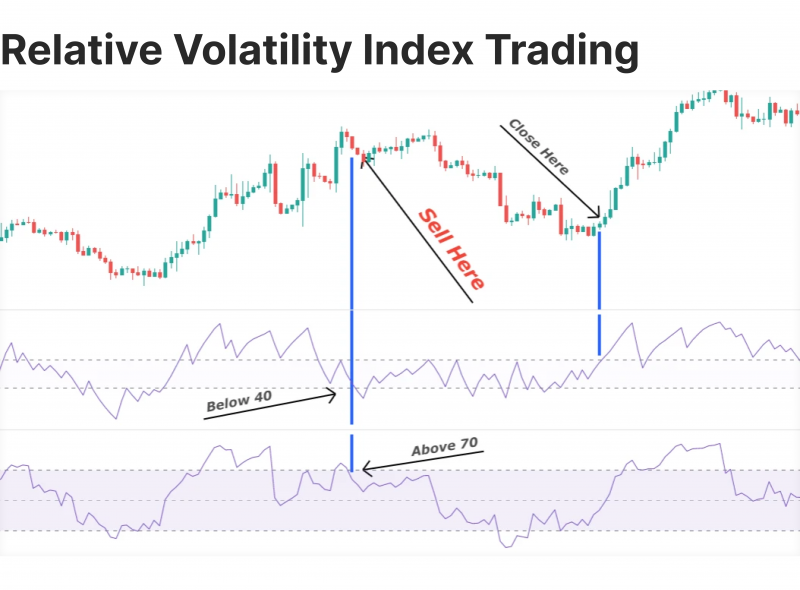
The relative volatility indicator formula is relatively simple to calculate. The formula consists of two key components: the standard deviation of high prices and the standard deviation of low prices over a defined period. These components help in assessing how much prices fluctuate during the given timeframe.
Here’s a simplified version of the RVI formula:
RVI = (UPS / (UPS + DOWNS)) * 100
Where:
UPS = Sum of standard deviations of up days over N periods
DOWNS = Sum of standard deviations of down days over N periods
Have a Question About Your Brokerage Setup?
Our team is here to guide you — whether you're starting out or expanding.
N = Number of periods (typically 14)
Let’s break it down step-by-step:
- Begin by analysing price movements within your chosen timeframe (often 14 days). Mark periods where the closing price is higher than the previous day’s close as “up” and vice versa for “down.”
- Calculate the standard deviation for both “up” and “down” periods. Standard deviation measures the dispersion of data points from the average.
- Divide the standard deviation of “up” periods by the standard deviation of “down” periods.
- Finally, multiply the result by 100 to express the result as a percentage between 0 and 100.
It’s important to note that this formula might seem complex in real life, and many traders rely on trading platforms or software to perform these calculations automatically. Using the relative volatility index calculation allows you, as a trader, to quickly assess whether a market is becoming more or less volatile, helping you to adjust your trading strategies accordingly.
Professionals use the RVI Indicator to identify trends and selling or buying conditions through reversal, divergences, or simple buy-and-sell techniques.
How to Use It
The RVI is most commonly used to generate trading signals when the market reaches certain levels. When the value is above 50, it suggests that prices are increasing with high volatility, indicating potential buying opportunities. Conversely, when the value is below 50, it points to decreasing prices and higher volatility, signalling potential selling opportunities.
Overbought and Oversold Conditions
The relative volatility index indicator can be particularly useful in identifying oversold conditions or overbought markets. When the indicator reaches extreme levels (near 0 or 100), it may indicate that a price reversal is likely. These signals allow traders to enter or exit trades before the market corrects itself.
Divergence
Look for divergences between the RVI and price action. For example, if prices are making new highs but the RVI is failing to do so, it could signal a potential trend reversal.
Confirming Other Indicators
As a confirming indicator, the RVI is often used in conjunction with other technical indicators. For example, traders may combine it with the RSI to gain a clearer picture of both momentum and volatility. This combination can be particularly powerful in identifying whether price movements are supported by underlying volatility, offering better insight into potential trade setups.
Advantages of the Relative Volatility Index
One of the key benefits is its ability to adapt to different market conditions. Since the RVI adjusts to price swings, it can be applied in both trending and defined range markets. Traders benefit from this flexibility, as it offers consistent signals in a variety of trading environments.
Reflecting Price Movements
The RVI excels at identifying price movements that are accompanied by high or low volatility, which makes it ideal for traders looking to capitalise on trend strength. For example, a trader may notice that the RVI value is rising alongside increasing prices, suggesting that the upward trend is supported by solid volatility.
Providing Clear Trade Signals
The RVI’s clear cut-off points (above or below 50) make it easy to generate actionable trade signals. Traders can rely on these signals to make quick decisions, whether aiming to capitalise on price increases or preparing for downside movements.
RVI on TradingView
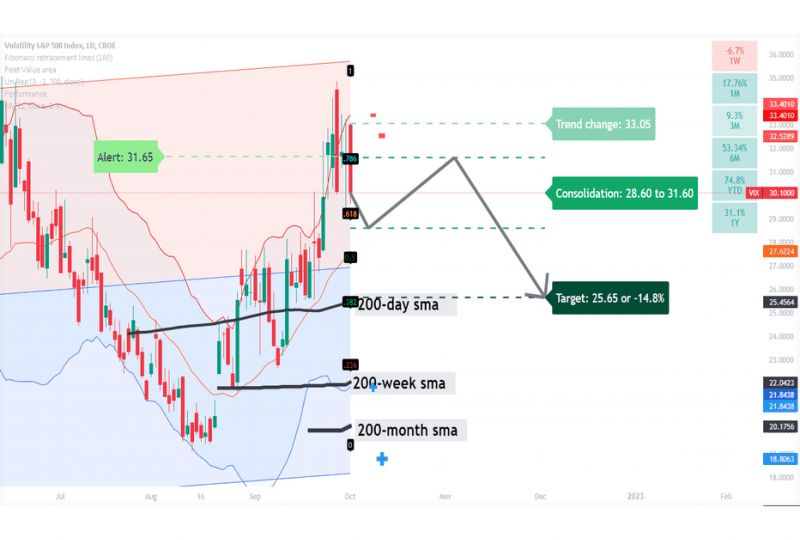
Platforms like TradingView offer easy access to the relative volatility index indicator, allowing traders to overlay it on their price charts. This feature simplifies the process of incorporating the RVI into a trading strategy, as traders can visually assess the relationship between price movements and swings without manually calculating the indicator.
Incorporating the relative volatility index into TradingView charts is straightforward. To add, simply search for “RVI” in the indicator list and add it to your chart. TradingView allows you to customise the indicator’s settings, including the Number of periods and visual appearance, to suit your trading style.
Comparing RVI to Other Volatility Indicators
While the relative volatility index offers unique insights, it’s essential to understand how it compares to other popular volatility indicators:
Relative Strength Index (RSI)
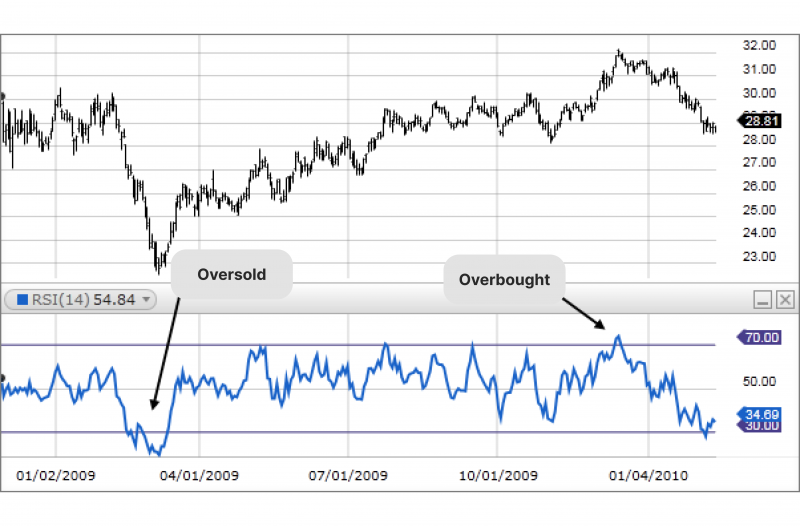
The RSI is a measure of the momentum of price changes, while the RVI reflects volatility. Both indicators can be used to confirm each other, with the RVI focusing on the volatility component that can provide more comprehensive insight into the strength of a price move.
Average True Range (ATR)
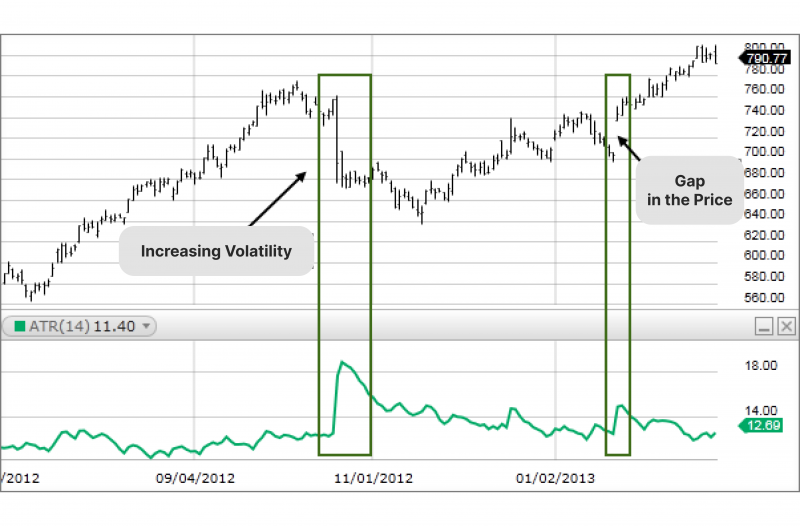
The ATR measures the magnitude of price volatility but doesn’t provide directional information.
Discover the Tools That Power 500+ Brokerages
Explore our complete ecosystem — from liquidity to CRM to trading infrastructure.
Bollinger Bands
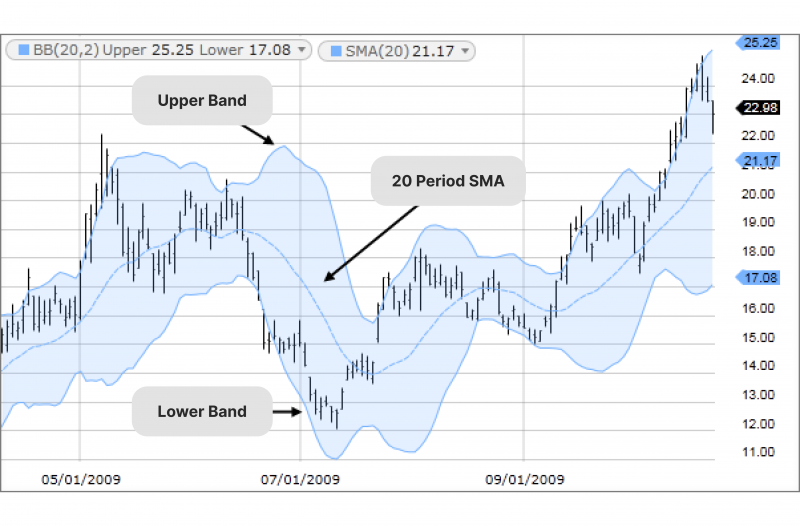
While Bollinger Bands visualise volatility through the width of the bands, they don’t offer the same directional insights.
Chaikin Volatility
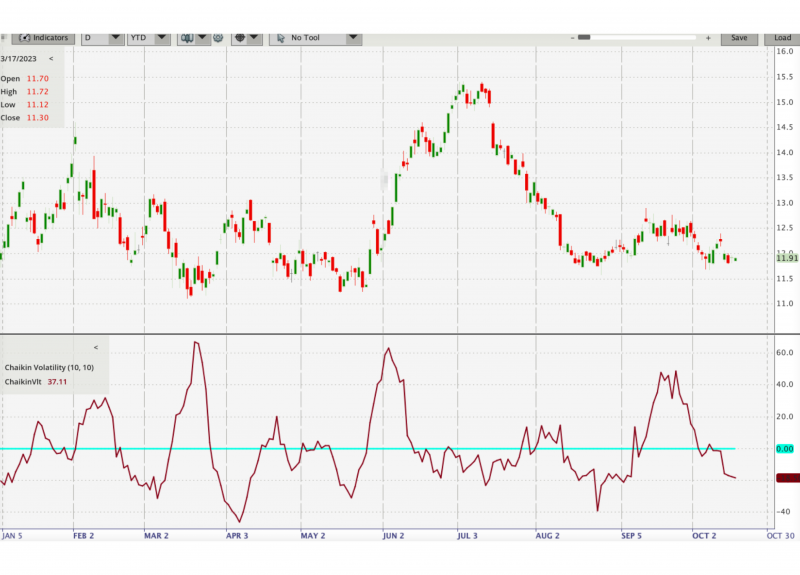
This indicator measures the rate of change of the ATR, providing a different perspective on volatility compared to the RVI’s focus on directional volatility.
Integrating RVI into Your Trading Strategy
To effectively use this index in your trading strategy, consider the following approaches:
- Trend Following: Use the RVI to confirm the strength and direction of trends identified by other indicators or chart patterns.
- Breakout Trading: Look for situations where the RVI diverges from price action, potentially signalling an impending breakout.
- Mean Reversion: Use extreme values (overbought/oversold) in conjunction with other indicators to identify potential reversal points for mean reversion strategies.
- Risk Management: Incorporate RVI readings into your risk management process, adjusting position sizes or stop-loss levels based on the current volatility direction.
Conclusion
The RVI is a practical tool that helps traders identify potential opportunities and assess risks. Its formula is designed to be straightforward, making it accessible for users without extensive financial knowledge, and it works well alongside other indicators like the RSI.
Rather than replacing personal judgment, the RVI supports informed decision-making by offering clearer insights into market trends. While no tool can predict market movements with certainty, using the RVI as part of a broader strategy can provide a more detailed understanding of market behaviour, helping traders respond more effectively to its changes.


