Triangle Patterns in Trading: Ascending, Descending, and Symmetrical
In trading, spotting price changes can help predict market shifts. Triangle chart patterns are among the most potent formations in candlestick analysis, providing traders with invaluable clues about periods of stalemate and likely reversal points.
These patterns appear when price action compresses within a narrowing range, forming a distinct triangle shape on the chart. As the market reaches this “pressure point,” a breakout is often imminent, signalling attainable profit options.
This article is a brief guide on triangle patterns, their variations, and what should be considered when working with them in trading practice.
Key takeaways
- In technical analysis, a triangle pattern is a chart formation that creates a triangle-like shape, signalling potential market direction.
- Triangles resemble wedges and pennants and can act as continuation sequences if confirmed or powerful reversal patterns if they fail.
- Three types of triangle patterns can form as price action consolidates: ascending, descending, and symmetrical triangles.
What Are Triangle Patterns?
Triangle formations are chart structures in market analysis that indicate periods of price equilibrium and the likelihood of selloffs in capital markets.
These patterns are formed when the price of an asset moves within a narrow range, creating a triangular shape on the chart. Traders use triangle patterns to predict potential price swings based on the triangle type and the breakout’s direction.
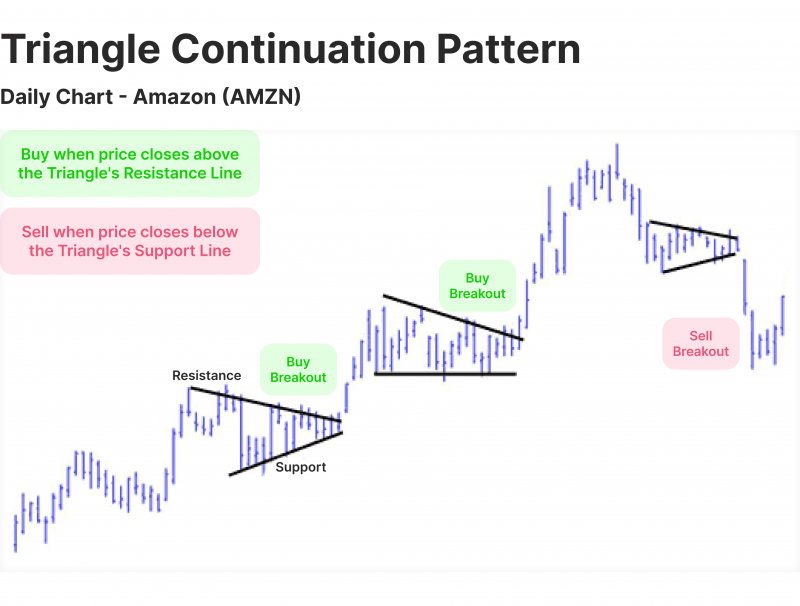
Triangle patterns are powerful indicators in technical analysis as they represent a battle between buyers and sellers, leading to a retracing phase before a significant price movement. These patterns reflect market indecision, where neither buyers nor sellers have control and the asset’s price moves within a tightening range.
As the range narrows, the market pressure builds, often resulting in a breakout once one side gains momentum. The direction of the selloff — either above the upper trendline or below the lower trendline — typically signals the likely future direction of the asset’s price, whether upwards or downwards.
To effectively trade triangle patterns, traders often combine them with other technical metrics for confirmation. For example, increased trading volume at the triggering point can validate the anticipated move and indicate strong buying or selling momentum.
Additionally, tools like the relative strength index (RSI) or moving averages can be used to gauge the current trend’s strength and help traders decide whether the breakout aligns with the broader market context.
Triangle patterns are versatile and adaptable, appearing in various timeframes and throughout multiple asset classes, from stocks and Forex to commodities and cryptocurrencies. Their ability to capture market consolidation and forecast potential reversals makes them a key component in many trading strategies.
However, since false breakouts can occur, traders must employ risk management techniques, such as setting stop-loss orders or adjusting position sizes, to protect against unexpected reversals. When used judiciously, triangle patterns can offer traders an effective way to navigate market trends and capitalise on price spikes and drops.
Triangle patterns can act as continuation or reversal signals, depending on whether the breakout aligns with or opposes the current trend.
Main Types of Triangles Chart Patterns
In technical mathematical analysis, triangle patterns are classified into three main types: ascending, descending, and symmetrical. Each of these triangle patterns has unique characteristics that suggest the possibility of price fluctuating based on the forces of supply and demand within a market. Here’s a breakdown of each type:
Have a Question About Your Brokerage Setup?
Our team is here to guide you — whether you're starting out or expanding.
Ascending Triangle Pattern
An ascending triangle is formed by a horizontal resistance line at the top, with an upward-sloping trendline of higher lows beneath it. The price action indicates buyers consistently stepping in at higher prices, creating upward pressure as the asset approaches the resistance level.
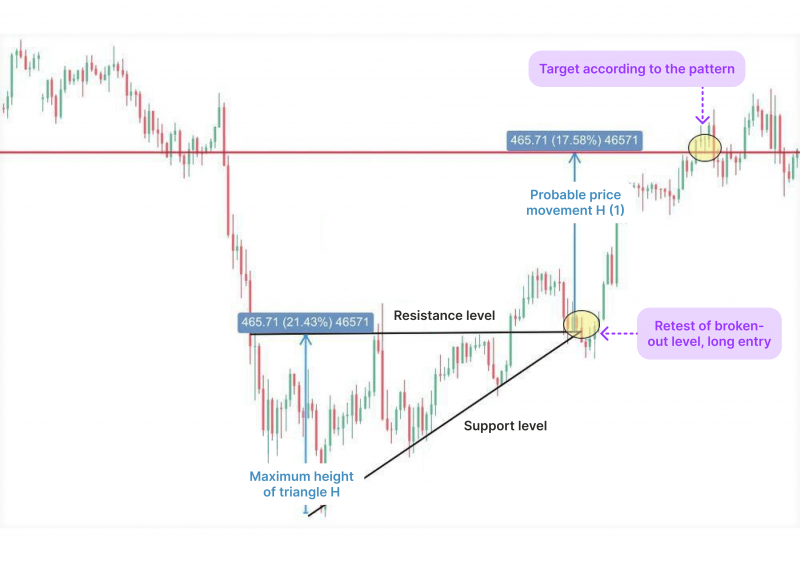
This pattern is typically bullish and often appears during an uptrend. The horizontal resistance level shows where sellers are initially active. However, as buyers gain strength and continue to drive prices higher, the likelihood of a breakout above the resistance level increases.
A breakout above the resistance line is usually seen as a signal to buy, suggesting buyers overpowered sellers, potentially leading to upward momentum. Traders may enter long positions upon breakout confirmation, often with increased trading volume as validation.
Descending Triangle Pattern
A descending triangle is the opposite of an ascending triangle. It is formed by a horizontal support line at the bottom and a downward-sloping trendline of lower highs. This indicates that sellers repeatedly lower prices, even as buyers attempt to hold the support level.
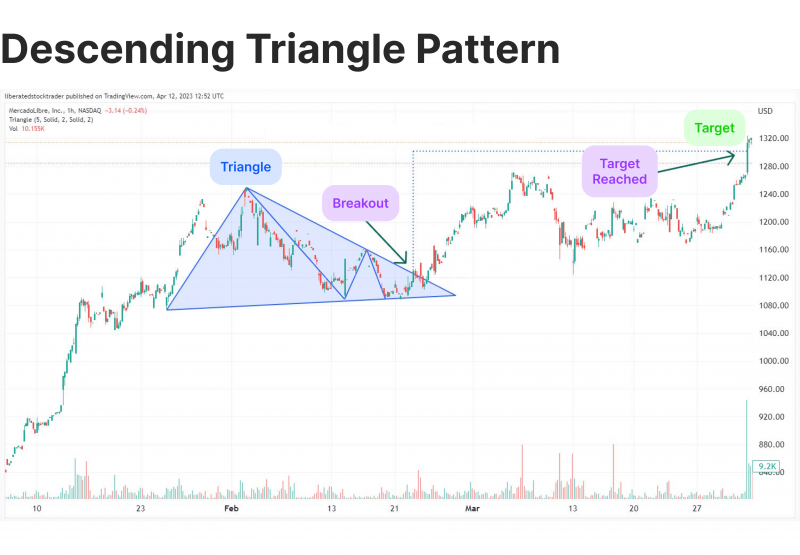
This pattern is generally considered bearish, often forming during a downtrend as sellers maintain control and buyers struggle to push prices back up. The descending trendline shows the gradual weakening of buying pressure.
A breakout below the support line is typically viewed as a sell signal, suggesting that sellers have overwhelmed buyers. This breakout often signals further downside momentum, and traders may enter short positions, with higher volume at the breakout point acting as confirmation.
Symmetrical Triangle Pattern
A symmetrical triangle is formed by two converging trendlines of higher lows and lower highs, creating a symmetrical shape. This pattern indicates that neither buyers nor sellers have complete control, leading to a convergent phase. The price moves within this narrowing range as market participants await a clear direction.
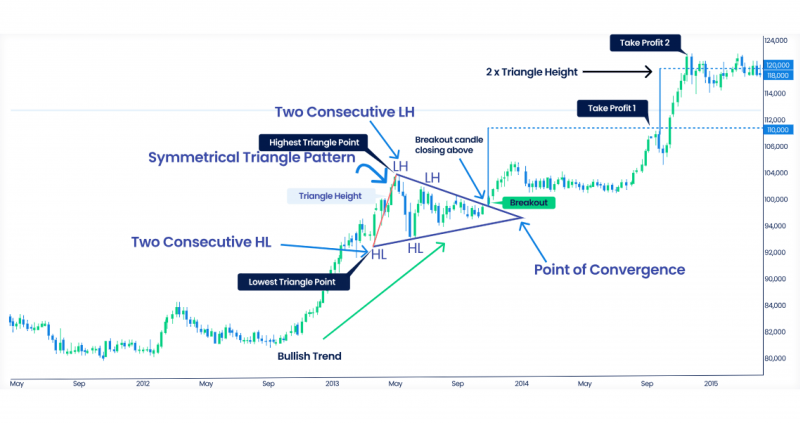
Unlike ascending and descending triangles, the symmetrical triangle is neutral and can break out in either direction. It often represents a period of indecision in the market, with buyers and sellers in relative balance. When the breakout occurs, it typically signals the beginning of a strong trend in the direction of the reversal.
Traders generally wait for the price to break above the upper trend line or below the lower trend line before taking action. Volume is key to confirming the breakout direction; the resulting move can be bullish or bearish. Symmetrical triangles are versatile and can appear in both uptrends and downtrends, making them useful across various market conditions.
Interpreting Triangle Patterns in Technical Analysis
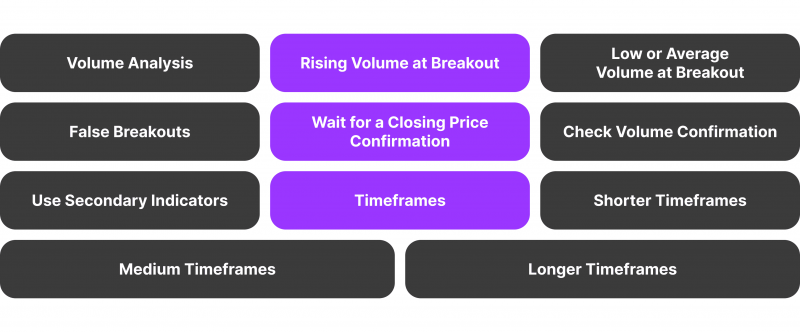
Triangle patterns are valuable indicators in technical analysis, often signalling a breakout after a period of price retracing. However, interpreting these patterns accurately requires understanding the role of volume, recognising false breakouts, and selecting the right timeframes.
Volume Analysis
Volume plays a critical role in confirming breakouts from triangle patterns. When the price oscillates above or below the trendlines that form the triangle, the increased volume suggests that the breakout is likely genuine and has momentum behind it. For example:
Rising Volume at Breakout
A strong increase in volume indicates that the breakout has conviction, meaning there’s broad market support for the new direction. This often shows that the breakout will continue and not revert quickly.
Low or Average Volume at Breakout
When volume is low or below average during a breakout, it can signal a lack of commitment from buyers (in an upward breakout) or sellers (in a downward breakout). This situation increases the risk of a false spike, where the price reverses into the triangle pattern.
In short, volume is an essential confirmation tool for triangle breakouts, with high volume supporting the breakout’s validity and increasing the likelihood of continued price swings in the breakout’s direction.
False Breakouts
False breakouts can be frustrating for traders, as they can lead to premature entries and possible losses. Here’s how to figure out and avoid them:
Wait for a Closing Price Confirmation
Instead of entering a trade immediately when the price crosses a trendline, many traders wait until the price closes outside the triangle on the chosen timeframe (e.g., the daily close for swing traders). This approach reduces the likelihood of entering on a short-lived spike above or below the trendline.
Check Volume Confirmation
High volume should accompany a breakout to validate the move. Without volume liquidity, a consolidation may lack the momentum needed to sustain it, increasing the chances of a reversion.
Use Secondary Indicators
Confirming breakouts with secondary indicators like relative strength index or moving averages can provide additional confirmation. For instance, if RSI supports the direction of the excursion (e.g., RSI above 50 on an upward breakout), it strengthens the validity of the move.
Discover the Tools That Power 500+ Brokerages
Explore our complete ecosystem — from liquidity to CRM to trading infrastructure.
By using these techniques, traders can reduce the impact of false breakouts and increase their chances of entering trades in line with a genuine trend.
Timeframes
Selecting a suitable timeframe is crucial for accurately deciphering and trading triangle patterns. Different timeframes serve different trading styles, and patterns on longer timeframes often signal more significant moves:
Shorter Timeframes
Ideal for day traders, shorter timeframes (e.g., 5-minute, 15-minute, 1-hour) can produce quick breakouts but may also lead to more noise and false breakouts. Using volume and waiting for confirmation is especially important in these timeframes to avoid whipsaw movements.
Medium Timeframes
These timeframes (e.g., 4-hour, daily) are well-suited for swing traders, as triangle patterns here tend to provide more reliable breakouts that align with larger trends. Medium timeframes often capture trends that last several days to weeks.
Longer Timeframes
Triangle formations on longer timeframes (e.g., weekly, monthly) usually suggest significant price moves, representing longer reversal periods. Breakouts on these charts are often meaningful, and the resulting trend can last from weeks to months. Long-term investors use these patterns to capture major trend shifts.
Conclusion
Triangle charts are invaluable components in market analysis, offering investors a glimpse into upcoming price oscillations by highlighting market convergence phases and probable selling points. Understanding the distinctions between the triangles discussed allows traders to anticipate market direction based on patterns that reveal underlying bullish or bearish moods.
Incorporating triangle patterns into a trading strategy enhances risk management and positions traders to capitalise on emerging trends and price declines with greater confidence. Combined with other metrics, triangle indicators become essential components for traders seeking to navigate the complexities of the financial markets effectively.
FAQ
What are triangle chart patterns in trading?
Triangle formations are chart formations in the graph analysis that indicate cycles of price retraction followed by a potential selloff.
How does an ascending triangle structure operate?
In an ascending triangle, buyers push the price higher with each successive low, creating upward pressure as the asset approaches a resistance level.
What does a descending triangle indicate?
A descending triangle correlates with a bearish mood, with sellers consistently pushing prices lower against a support level.
What makes a symmetrical triangle different?
Symmetrical triangles represent market indecision, with neither purchasers nor sellers in a position of influence.
Why is volume significant in triangle breakouts?
Volume confirms breakouts; a substantial increase at the release point means it’s likely to sustain, while low volume raises the risk of a false spike, leading to a quick price reversal.


