What Is a Liquidity Gap in Finance and Trading?

Thriving in the world of trading calls for balance and stability, particularly among financial institutions. Banks maintain carefully balanced reserves, firms rely on steady cash flow to power their operations, and traders cope with changing market conditions.
Despite careful planning, market imbalances can still impact fund flow and market activity. These imperfections create liquidity gaps that significantly distort your financial planning.
Here, we will discuss these gaps, their importance, and how they impact the overall financial environment.
Key Takeaways
- There is a lack of cash to pay bills when there is a liquidity gap.
- Control of the liquidity voids is paramount to banks and businesses in order to gain financial solidity as well as smooth operation.
- Gaps in trading are imbalances of buyers and sellers that are generally characterised by large and sharp price movements.
- Short-run market imbalances are referred to as fair value gaps, but larger and longer-running voids are referred to as liquidity voids.
What Is a Liquidity Gap?
A liquidity gap refers to a mismatch of cash inflows and outflows within a particular time frame. It describes a deficiency that occurs where obligations are greater than available funds. The mismatch may cause temporary or extreme financial pressure based on its amount and time.
Liquidity gaps are not limited to a single area; they occur in banking, business transactions, and trading. They are especially meaningful within settings where time and access to funding are paramount.
Why Liquidity Gaps Matter
Gaps in liquidity are key determinants of financial health. Unmanaged, they can lead to missed payments, decreased creditworthiness, or market inefficiency. On the contrary, proper identification and control of the gaps can lead to maximised operations and profitable trading strategies.
Liquidity Gaps in Banking
For banks, liquidity gaps represent a fundamental risk. A bank’s liquidity gap measures the ratio between its liquid assets and its liabilities over specific timeframes.
A key metric for assessing a bank’s liquidity position is the Liquidity Coverage Ratio (LCR), introduced under Basel III regulations. The LCR is defined as:

Banks are required to maintain an LCR of at least 100%, ensuring they have adequate liquidity to withstand short-term stress scenarios.
Have a Question About Your Brokerage Setup?
Our team is here to guide you — whether you're starting out or expanding.
Regulatory bodies often require banks to conduct stress tests to ensure resilience against significant liquidity gaps. These tests simulate adverse scenarios, such as a sudden spike in withdrawals or market shocks.
Liquidity Gaps in Businesses
Liquidity gaps are just as vital to businesses, and they affect cash flow directly. For example, a retailer faces a liquidity gap if payables to suppliers come before payment from the customer. The shortage of funds can disrupt operations or compel a business to seek expensive short-term financing.
Most firms use liquidity ratios to assess their ability to settle short-term liabilities.
Current Liquidity Gap Ratio
Measures the ability to cover short-term liabilities with short-term assets. It indicates whether a company can meet its immediate obligations using its available resources.
The liquidity gap formula looks like this:

A ratio above 1 is generally favourable, as it suggests the company has more assets than liabilities due in the short term. However, an excessively high ratio might indicate underutilised assets.
Quick Ratio
Also known as the acid-test ratio, it assesses the ability to meet short-term obligations with the most liquid assets. It provides a stricter measure of liquidity compared to the current ratio.
Calculated as:

A quick ratio above 1 implies that the business can cover its liabilities without selling inventory, which is beneficial during periods of rapid financial strain.
A high acid-test ratio (above 1.0) isn’t always good—it can mean cash is sitting idle instead of being reinvested or used productively. Some sectors, like retail, may naturally have lower ratios without issues.
What Are Liquidity Gaps in Trading?
A gap in liquidity, or a void in liquidity, arises by way of a steep and dramatic decrease in buyers or sellers in the market, which allows for rapid changes in the price and increased volatility.
These voids tend to appear in the order book as regions with limited or no buy or sell orders within a specific price range. As a result, when a trade is executed in such areas, prices can jump to the next available order level, potentially causing abrupt price changes.

Causes of Liquidity Gaps
Liquidity gaps don’t happen by chance. They are often caused by specific events or conditions that upset the balance of buyers and sellers. Here are some common reasons:
- Market Events and News: Unexpected news, such as a sudden shift in interest rates or poor earnings, can lead to a cash shortage in Forex or other markets. Traders may cancel orders or flood into the market, adjusting prices.
- Low Participation: During quiet times, like overnight trading, fewer people are active in the market. This can leave gaps in the order book, making sudden price changes more likely.
- Algorithmic Trading: High-speed trading algorithms can worsen liquidity gaps by quickly withdrawing or executing large orders. These programs respond to market conditions and can magnify price movements.
- Market Manipulation: Traders sometimes use tactics like spoofing, where they place and cancel large orders to create fake demand or supply, leaving artificial gaps in the market.
Fair Value Gap vs Liquidity Void
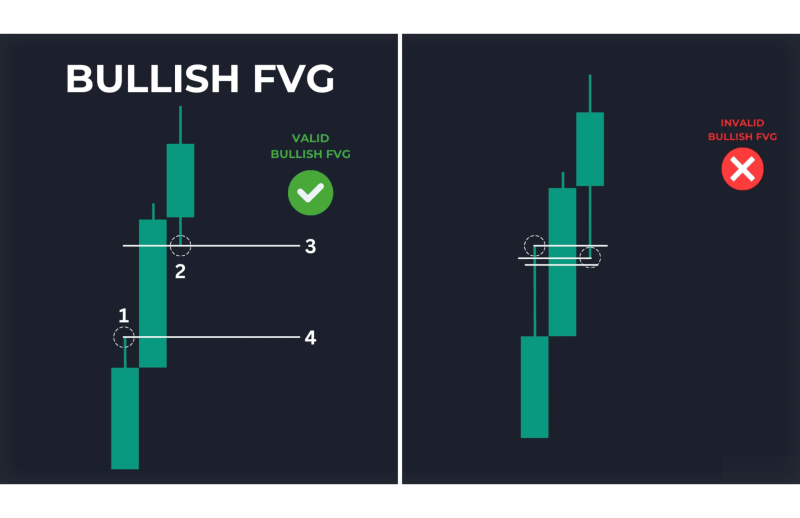
Fair value gaps (FVGs) and liquidity voids both highlight instances when supply and demand in the market are out of balance, but they differ in terms of size and duration over time.
Fair Value Gaps
FVGs are smaller, short-term gaps that occur when there isn’t enough buying or selling to counter a strong market move. This imbalance usually shows up as a specific pattern on a price chart and indicates that prices moved too quickly, leaving behind areas of little to no trading. Over time, prices often return to these gaps as the market looks to balance out.
- Seen on lower timeframes.
- Represent smaller-scale supply and demand imbalances.
- Prices often retrace to these areas later.

Liquidity Voids
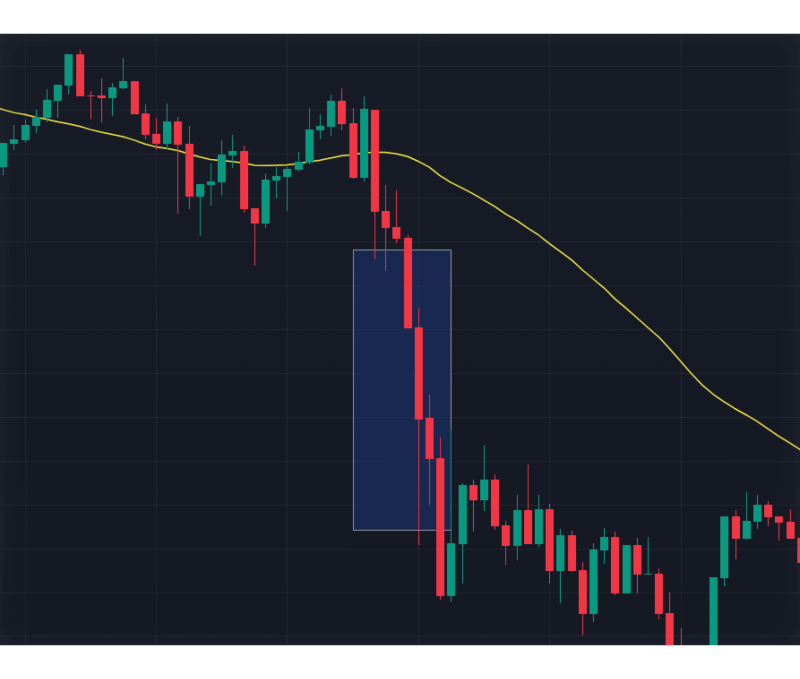
Liquidity voids are larger and occur when prices move sharply in one direction, often after major news or events. These areas show very little trading activity and can span multiple fair value gaps. On higher timeframes, liquidity voids are easier to spot and often signal areas where the market may return to “fill the void” or consolidate.
Discover the Tools That Power 500+ Brokerages
Explore our complete ecosystem — from liquidity to CRM to trading infrastructure.
- Span over longer periods and higher timeframes.
- Represent significant market imbalances.
- Can indicate strong trends or areas for future retracement.
The difference between FVGs and liquidity voids often depends on the timeframe the trader is analysing. On smaller charts, liquidity voids might appear as multiple FVGs, while on larger charts, those same FVGs may combine into a single void. Both highlight the same concept of imbalance but show it at different scales.
Benefits of Liquidity Gap Trading
Trading liquidity voids can be both an exciting opportunity and a challenge. Here’s why traders use these voids in their strategies:
- Profit Potential: Market voids tend to predict large price movements, presenting trading opportunities to reap instant profits. Market gaps tend to attract a retracement or continuation of the price, making them potential areas for strategic entry and exit.
- Market Analysis: FVGs and liquidity voids reveal market inefficiencies, providing traders with a better understanding of where the next path of price action is likely to lead. Determining these voids can anticipate where trends will reinforce or where areas of retracement can occur.
- Trend Confirmation: To confirm whether a trend will continue in a specific direction or turn, one must observe how prices react to areas of illiquidity.
Risks of Trading Liquidity Voids
While liquidity voids can be helpful, trading them comes with some risks:
- Market Manipulation: Liquidity voids can sometimes result from manipulative practices, such as spoofing or intentional gaps created by large “smart money” institutions. Trading in such conditions can be risky without proper safeguards.
- High Volatility: Liquidity voids often occur in environments with low market participation, resulting in extreme price swings. Volatility like this increases the risk of rapid losses.
- Timeframe Challenges: The interpretation of liquidity voids depends heavily on the timeframe. A void on a lower timeframe might not align with trends on higher timeframes, creating conflicting signals.
- Emotional Bias: Traders may over-rely on the assumption that all voids will eventually be filled. This bias can lead to holding positions longer than necessary or misjudging market momentum.
Conclusion
Liquidity gaps are principal financial concepts that identify areas of mismatch that can create risk or possibilities. Bridging these gaps in banking or business activities is central to financial success.
FVGs and areas of liquidity are effective market behaviour indicators in trading. From the analysis of a liquidity gap, one can identify supply-demand imbalances that are often signals of entry points, exits, or the redefinition of a trader’s positions.


