Forex Line Trading – How To Excel at Reading Price Trends

The foreign exchange market is the largest and most popular way to get involved in trading and grow your wealth. The market consists of many traders, institutional traders, investors, brokers, service providers, liquidity pools and other market participants.
Thriving in the Forex market does not come by chance. Although some luck is needed, traders deploy carefully researched tactics and strategies to identify and capitalise on growing trends and opportunities.
Forex line trading strategy is a common approach to locating trends and determining the right time to enter the market and maximise your gains. This approach entails various technicalities and analyses that we will explain in this step-by-step guide.
Key Takeaways
- The Forex line trading tactic is used to identify market entry and exit points marked by important levels of support and resistance.
- The Forex line can be an upward, downward, or sideway trend, indicating the current and future price action and direction.
- The trend line is drawn by identifying two or three prominent price swing points and connecting them with a straight line heading downwards or upwards.
- The Forex line trading is combined with other trading strategies, like day trading, trend bounces and breakouts.
Understanding Forex Line Trading
Trend lines are used to understand current and potential price action based on market movements. The Forex line trading strategy works by connecting price points on the upward and downward trend lines to find out the market direction and other critical information.
Forex trend line trading is used to locate support and resistance levels, which assist the trader in finding the optimum moments to enter and/or exit the market and to understand the potential direction and intensity of the Forex market trend.
Trend lines are common technical indicators used to highlight the current and historical market trends and determine if the price is catching up on a positive (upward) or negative (downward) trend, indicating if the trader shall place a buy or sell order. Trading Forex using the line chart is combined with drawing lines and some technicalities, which we explain below.
Uptrend Lines
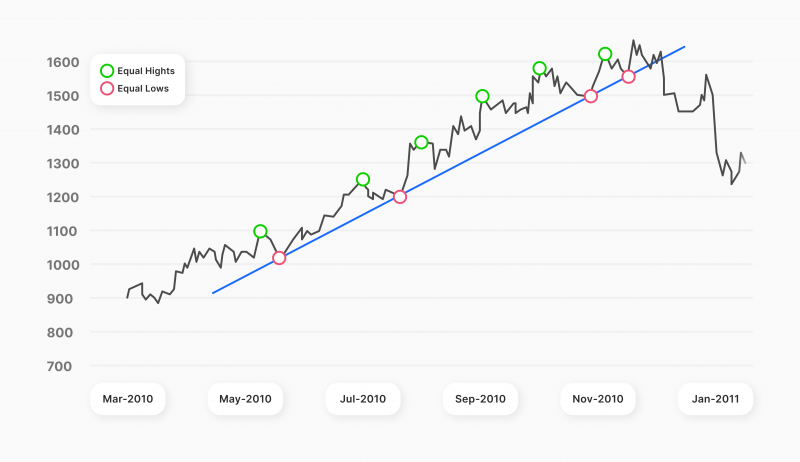
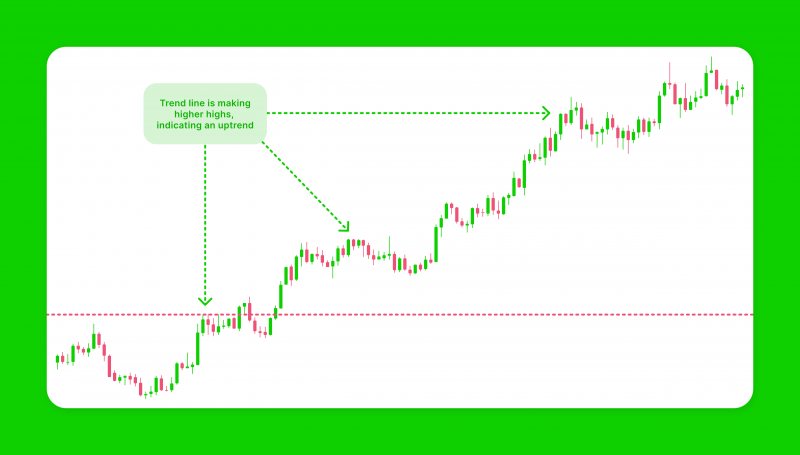
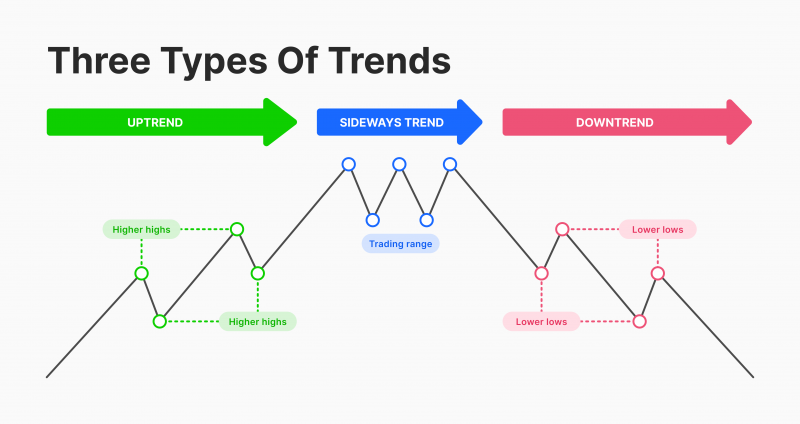
When the asset’s price increases for a period of time, it creates an upward market trend, indicating an uptrend. This event is illustrated on the chart with each price block or string higher than the previous one. Therefore, the bottom end of each candlestick is higher than its predecessor.
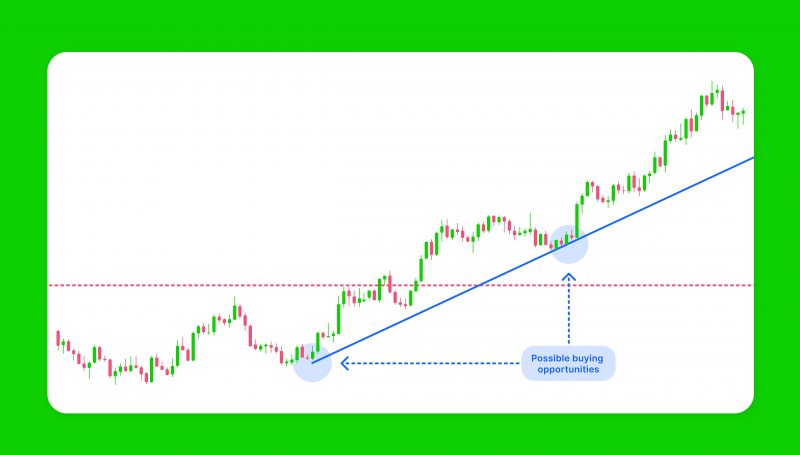
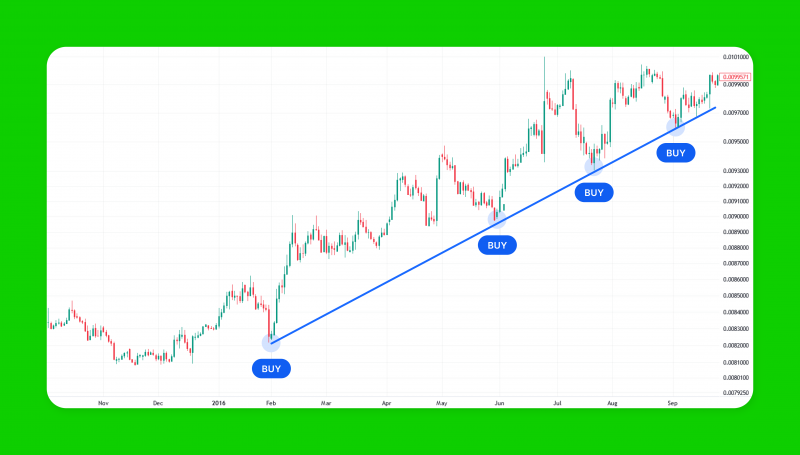
The uptrend line is depicted by connecting the climbing lower ends of the price line, which finds and supports the bottom of a price string. Forex traders analyse these upward market movements as an entry point to start buying a security.
Downtrend Lines
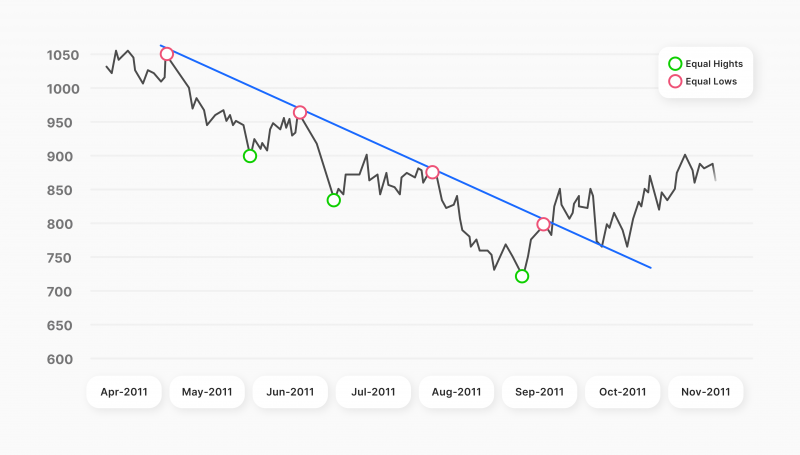
When the asset’s price decreases for a period of time, it creates a downward market trend, indicating a downtrend. This event is depicted on the trading chart as each new price string is lower than the previous one. Thus, the high end of each candlestick is lower than its predecessor.
The downtrend line is drawn by connecting the declining high end of each price string, which also creates the resistance level. Traders analyse these downward market actions to close a long position or start shorting (selling) tradable securities.
Sideway Lines
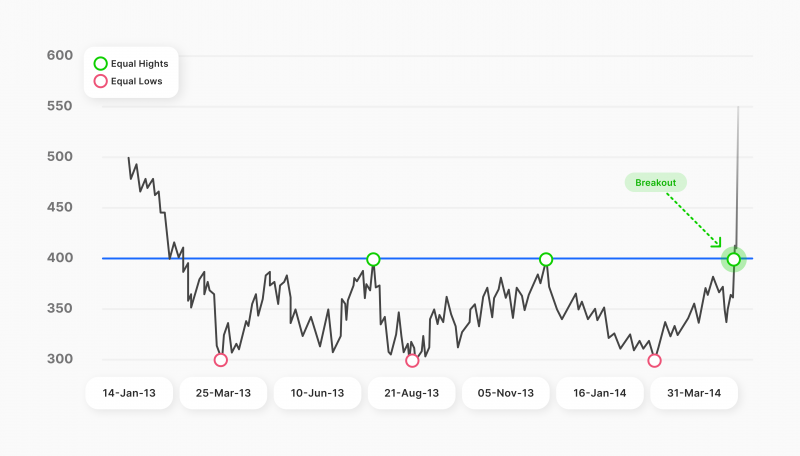
When the asset price fluctuates up and down in a controlled pattern, it creates sideway lines, which are depicted on the top and bottom of the price chart. This event is illustrated on the chart with the price trend moving horizontally without establishing a clear uptrend or downtrend line.
The sideway lines are drawn by connecting the upper ends and lower ends of both sides of the price line, creating auto support and resistance indicators. The sideway lines indicate the range within which the asset’s price is moving without breaking through the top or bottom end.
How to Draw Forex Trend Line
Forex line trading is one of the most common ways to identify and track a price action when using the trend trading strategy. Moreover, knowing how to draw support and resistance lines is crucial to finding accurate market entry and exit points.
However, careful technical analysis is required because the market movement can be misleading. Here’s how you can accurately draw trend lines.
Locate the Trend Movement
The first step is to identify the market movement or sentiment, whether an upward, downward, or sideway trend. This can be determined by looking at the price strings on a chart or the bars of a candlestick chart.
An uptrend has higher tops and bottoms, which climb throughout the timeline. On the other hand, a downtrend is characterised by decreasing price blocks, with lower tops and bottoms, which decline as the price trend moves.
Have a Question About Your Brokerage Setup?
Our team is here to guide you — whether you're starting out or expanding.
You can accurately identify the trend line type by comparing various time periods, such as short-term vs long-term price action. Use historical times as longer time periods bring more accurate results.
Connect the Points
Draw a line to connect the low ends or the tops of price strings. For example, look for prominent higher lows and connect them with a line that lies under the price trend.
Meanwhile, downward trend points are located on the decreasing highs, where the line is drawn above the price trend. Ideally, each trend line should connect at least two swing locations.
Validate the Trend
The trend line can be continuously adjusted and validated as the market moves and changes. This requires checking more timelines and connecting more distinguished top and bottom points without breaking through the price line.
As the market moves, the price line may fluctuate more prominently, creating as many swing points that can be connected together to have a more accurate trend line.
Validating the trend line can also be done by comparing it against other price levels, such as the support and resistance indicator, which indicates the range within which the price trend bounces to the other side without creating breakthroughs.
Analyse The Line to Make a Decision
Utilise the drawn trend line to execute buy or sell orders. Ideally, Forex traders buy during an upward trend, with optimum points located as the price trend reaches or bounces up from the uptrend line.
On the other hand, in a downward trend, traders engage in selling or “shorting” orders, with optimum market entry points located as the price line returns or touches the downtrend line.
This approach can be used in conjunction with other technical indicators for more accuracy, such as moving averages or the relative strength index (RSI), which helps determine the overbuying and overselling pinpoints.
Despite being so common to make trading decisions, it is not a fool-proof tactic as markets are not guaranteed. For example, if the price reaches an uptrend line, there is a small chance for it to continue declining and make another return later on.
Tracking Forex Uptrends and Downtrends
Identifying a chart’s high and low points in the Forex market is essential to draw the trend line correctly. Therefore, most Forex traders follow this approach to ensure the accuracy of determining and drawing trend lines.
Identify Time Periods
Start by choosing the right time frame, depending on your trading strategy and style and the traded currency pair. Historical time periods show you previous data and price action, whereas higher timeframes entail higher accuracy because they accumulate more price data.
Selecting older times, like weekly and monthly price charts, enables you to analyse the price line with more high and low points of the trend, resulting in a more accurate trend line analysis.
Analyse and Connect Highs and Lows
Locate the highs and lows of price blocks accurately by finding the most prominent swings and buying or selling pressures. Market dynamics and price fluctuations may be misleading. Therefore, find significantly higher lows in an uptrend, while lower highs identify downtrends.
Refine the Trend Line
Adjust and refine the trend line by continuously assessing new market movements and natural fluctuations, which may result in new standout highs or lows. Analyse various timeframes to enhance the drawn trend line further and observe the market as it moves to include more prominent price swings.
Recognise the Trend
After highlighting significant price turns and drawing the trend line, you can analyse and conclude the trend direction accordingly, whether you have an uptrend, downtrend, or sideways trend.
The uptrend line lies underneath the price line and has an increasing tendency, signifying the bullish market pressures. On the other hand, downtrend lines are located above the price line and have declining tendencies as the bearish market prevails.
Repeat the process for an accurate trend line and use other technical analysis indicators that help you assess the best support resistance indicator, such as moving averages, stochastic oscillators, and relevant strength index.
These indicators help you determine the price bounce points and the asset overbuying and overselling levels, which indicate the price turn points.
Extending the Forex Trend Line
Currencies in the Forex market move continuously, and price trend lines can change repeatedly. Moreover, traders not only use trend lines to assess current trends but also implement this strategy to predict potential price movements and upcoming trends.
Therefore, extending the Forex trend line entails expanding the price chart to the future and continuing the previously drawn line in the same slope and direction. This way, you can predict futuristic support and resistance levels, determining market entry and exit points and prominent price bounces.
Depending on how strong the current and potential trend line is, traders predict future market action, whether the price will continue on the same trajectory or make later returns, changing the fluctuation pattern.
The Best Forex Trading Strategies with Trend Line
The Forex line trading acts as a tool to identify price action and combine it with other Forex trading strategies as follows.
Trend Line Breakouts
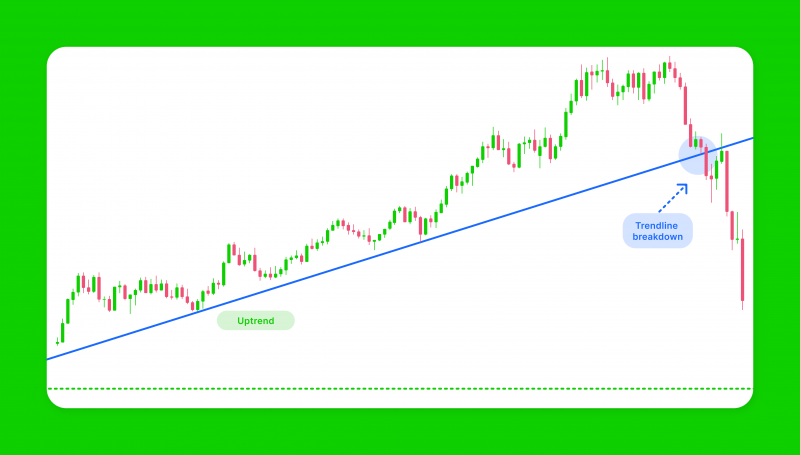
Trend line breakouts are the points when the price breaks through the trend line, whether uptrend or downtrend, indicating a new trend movement and direction. These points are critical to enter or exit the market depending on how the price and trend lines intercept.
It is important to have a valid trend line that has been challenged across different timeframes and connect three prominent points to ensure trend accuracy.
If the price line crosses above the (downtrend) trend line, it indicates a shift to an uptrend direction and the start of a bullish market. Traders can enter the market with sell orders to capitalise on trend shifts.
If the price line crosses below the (uptrend) trend line, it indicates a shift from an uptrend to a downtrend, marking the start of a bearish market opposite of resistance. In these moments, traders can place a buy order.
Discover the Tools That Power 500+ Brokerages
Explore our complete ecosystem — from liquidity to CRM to trading infrastructure.
However, it is important to observe the price action for a while before entering the market to validate the new changes and ensure they are not momentarily corrections to natural market dynamics.
Trend Line Bounces
Trend bounces are moments when the price line approaches the trend line, whether uptrend or downtrend and bounces back to the trend direction without breaking through. The bounces are used as signals to enter or exit the market, depending on the price line direction and trend movement.
If the currency pair price reaches the uptrend line and bounces upwards, it indicates an entry point for long positions (buy orders). Conversely, if the asset price reaches the downtrend line and bounces downwards, it indicates an entry point for short positions (sell orders).
Traders usually look at other signals to observe and confirm the bounces, such as trading volumes and market sentiments. Once the trend line bounce has been validated, traders can enter or exit the market.
Day Trading
Day traders use the support and resistance levels resulting from accurately drawing the trend line to market the appropriate entry and exit points.
Traders enter the market with long (buy) orders if the price line bounces upwards or crosses above the downtrend line. On the other hand, entry points with short (sell) orders are marked when the price line bounces downwards or breaks through the uptrend line in a declining trajectory.
The day trading strategy with the Forex trend line trading is followed by observing the market action. Traders track the price line as it approaches the trend line and make informed decisions if it crosses through or bounces off the trend.
Conclusion
Forex line trading is a tactic that entails tracking and drawing the trend line, observing the price movements and projecting current and potential support and resistance levels.
By accurately drawing the price trend, a trader can make informed decisions based on how the price line interacts with the trend line, whether it crosses or bounces from it, indicating market entry and exit moment.
The trend line trading strategy in Forex is combined with other trading strategies that involve verifying and projecting future prices and trading according to the price support and resistance levels.
FAQ
What is Forex line trading?
Forex line trading is a tactic traders use to identify market entry and exit points based on price action compared to the trend line. The price line may break through or return from the trend line, marking a bullish or bearish sentiment.
Is trendline strategy profitable?
The trend line tactic is commonly used to project support and resistance points and trade on both sides of the market price line. Therefore, it can be profitable if the trend line is correctly validated and challenged without facing unpredicted market changes.
What are the 3 touches on trendline?
The Forex trend lines (uptrends and downtrends) are validated and accurately illustrated when the line connects at least two or three price swing points.
What are the disadvantages of trendlines?
The market moves and fluctuates constantly, and price bounces and breakthroughs can be misleading if not observed and validated correctly. Thus, the price line may shortly cross the trend line before correction and returning to previous levels without marking a trend shift.


