Liquidity Ratio Explained: Types, Calculations & Benchmarks

When a sudden sell-off hits, your brokerage faces an immediate stress test. Client withdrawals surge exactly when upstream partners hike margin requirements on your open hedges. Survival comes down to one thing: available liquid capital.
Liquidity ratios measure whether you have the cash reserves to navigate these rapid shifts. For institutional brokerages and exchanges, these metrics are daily operational lifelines. They are used by regulators and risk teams to prevent catastrophic funding shortfalls.
This guide cuts through the theory. We will show you how the current, quick, and cash ratios actually function on a live trading floor, how to calculate them accurately, and what strategic levers you can pull to optimize your setup today.
Key Takeaways
- A liquidity ratio tracks your ability to cover immediate obligations using easily convertible assets. A baseline of 1.0 or higher is the standard for stable operations.
- The current, quick, and cash ratios provide progressively stricter lenses to stress-test your balance sheet against normal days, volatile swings, and severe market shocks.
- Generating decision-grade metrics requires real-time, reconciled data. Stale end-of-month numbers leave your dealing desk totally blind.
- Industry context matters. A healthy ratio for a traditional retail business often signals severe undercapitalization for a leveraged trading platform.
- Brokerages can actively improve weak positions by diversifying funding partners, compressing settlement cycles, and using technology to enforce real-time risk parameters.
What Is a Liquidity Ratio?
Liquidity ratio measures a company's ability to convert short-term assets into cash fast enough to cover imminent obligations.
It answers one brutal question. If every single short-term bill, client withdrawal request, and margin call landed on your desk today, could you cover all short-term obligations without selling off your long-term investments or begging venture capitalists for an emergency bailout?
One distinction matters here. Accounting liquidity (the focus of this article) measures what your balance sheet says about your ability to pay obligations. Market liquidity is a separate concept: it describes how easily you can trade an asset without moving its price.
If you want to understand the market side of things, check out the guide on crypto liquidity to clarify how order books and slippage actually function.

While market liquidity impacts how well your traders execute their orders, accounting liquidity dictates your financial health and whether your business actually survives the week.
For brokerages and exchanges, the pressure is different. A software company knows its payroll and vendor costs a month in advance. A brokerage faces client withdrawal patterns that shift without warning and settlement obligations that can flip in a single volatile session.
Core Types of Liquidity Ratios
No single financial ratio gives you the full picture. Risk managers use three distinct metrics, each one a stricter stress test than the last.
Current Ratio
The current ratio is the most forgiving measure of your short-term liquidity. It lumps together every single asset you expect to turn into cash within a year.
Formula: Current Ratio = Total Current Assets / Total Current Liabilities
Your assets here include cash in the bank, short-term investments, marketable securities, money owed to you by payment processors, and even physical inventory. Your liabilities include your immediate accounts payable, short-term debts, and the withdrawal requests sitting in your queue.
Let's say your brokerage has 100,000 in total current assets and 75,000 in current liabilities. You divide 100,000 by 75,000 and get 1.33. The 25,000 difference is your net working capital, and this is the buffer keeping operations running. It means you have a dollar and thirty-three cents in short-term assets for every single dollar you owe.
In a traditional business, anything over 1.0 means you are solvent. A lot of retail companies aim for 1.5 or 2.0. The gap between current assets and liabilities is your working capital, and the current ratio is your best-case read of it.
For financial services, this broad view is the problem. Brokerages don't hold physical inventory, so the current ratio captures assets that don't reflect real liquidity pressure. The quick ratio gives a more accurate read.
Quick Ratio
Often called the acid-test ratio, it strips out inventory and prepaid expenses and focuses only on the assets you can convert to cash within about ninety days.
Formula: Quick Ratio = (Cash + Short-Term Investments + Accounts Receivable) / Total Current Liabilities
Imagine your firm has 80,000 in cash and receivables and 75,000 in liabilities. Your quick ratio is 1.06, indicating you can cover your immediate obligations without selling any illiquid assets.
For brokerages, this ratio is particularly meaningful. Your asset mix tends to be dominated by cash and funds stuck in transit with payment providers, so the quick ratio gives a realistic picture of near-term survival. If it dips below 1.0, that's a signal worth taking seriously.
Cash Ratio
The cash ratio is the most conservative of the three. It answers a specific question: what happens if every counterparty stops paying you?
Formula: Cash Ratio = (Cash + Short-Term Investments) / Total Current Liabilities
Why exclude receivables? Because if the broader market is crashing, the money owed to you by a third-party payment gateway might get delayed for weeks. You cannot pay a margin call today with a promise that money is coming next Tuesday.
If your cash ratio is 0.50, you have enough cash on hand to cover half your immediate obligations. A ratio below 1.0 isn't a crisis by itself (very few businesses keep that much cash idle), but it means your ability to pay depends on collecting receivables on schedule.
Liquidity Ratio Formulas and Calculation Steps
No financial analysis is better than the data behind it. The quality of your inputs dictates whether your ratios are useful tools or dangerous illusions.
Gather Current Assets Data
Pull a list of everything expected to convert to cash within twelve months, using today's reconciled figures rather than a stale end-of-quarter snapshot. Include bank balances, money market funds, and funds owed by liquidity providers. For brokerages, add client margin deposits held in segregated accounts and any highly liquid securities. Grouping by settlement speed makes it easier to calculate all three ratios from the same dataset.
Gather Current Liabilities Data
Compile all obligations due within the next year: accrued expenses, short-term debt, the current portion of long-term debt, and client withdrawal obligations. Don't forget pending settlement amounts owed to counterparties. For exchanges, mass withdrawals can shift your liability column drastically within hours, so near-real-time visibility is essential.
Apply the Ratio Formulas
Calculate all three metrics at the same time to build a layered profile. If your current ratio looks great but your cash ratio is dangerously low, you know exactly where your vulnerability lies.

Let's look at a unified example. Say your trading firm has 5,000,000 in total current assets. If we strip out prepaid software licenses and other illiquid items, your quick assets are 3,000,000. If we strip out the money you are waiting on from payment processors, your actual cash on hand is 2,000,000. Your total current liabilities sit at 4,000,000.
Your current ratio comes out at 1.25, which looks healthy on paper. But your quick ratio is 0.75, meaning under moderate stress, you are already short. At a cash ratio of 0.50, a full market freeze would leave you unable to cover half your obligations.
Interpreting Liquidity Ratios for Brokerages and Exchanges
As a general rule of thumb, anything above 1.0 means you can cover your obligations. However, always benchmark against industry averages, since healthy thresholds vary significantly by sector. Financial firms operate under intense pressure, and standard rules rarely apply.
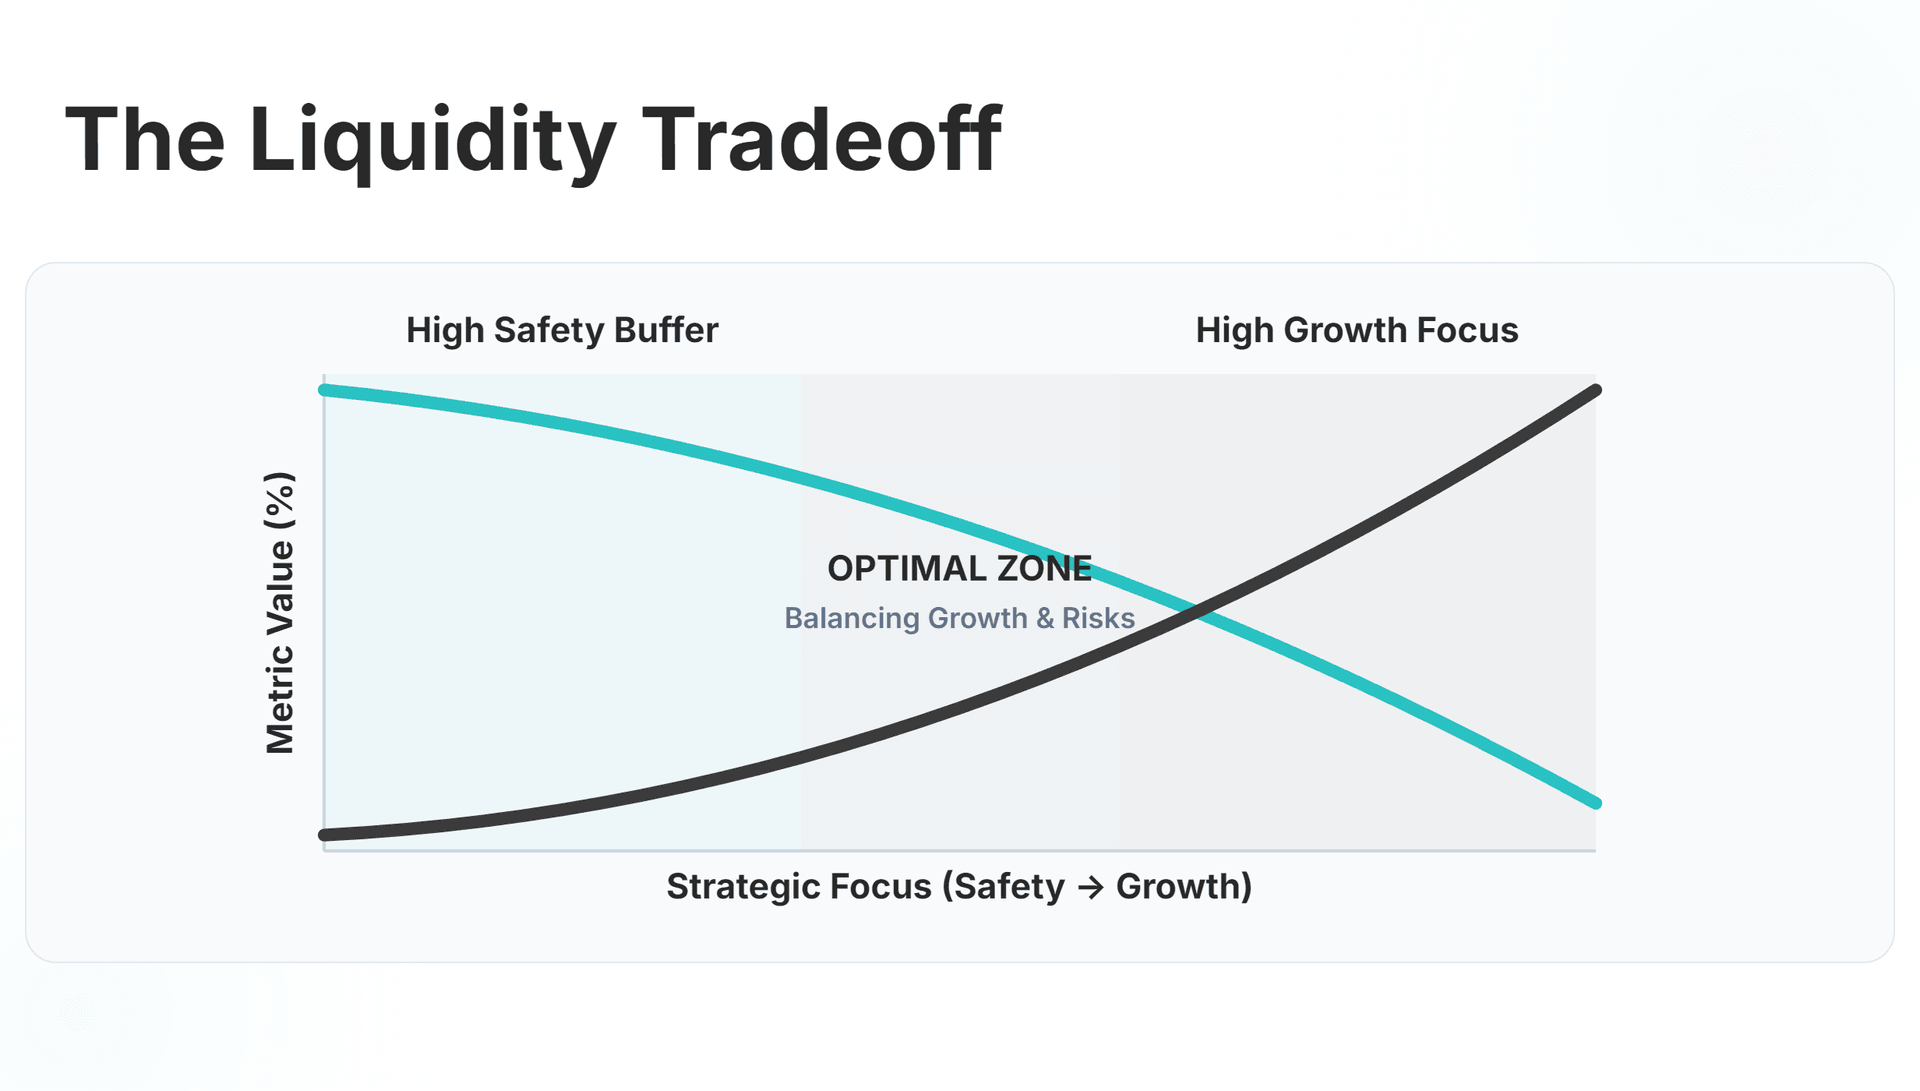
If your liquidity ratios are massive, say, 4.0 or 5.0, that is actually a problem. It means capital is sitting idle instead of being deployed. Investors read that as inefficiency, and it shows up directly in profitability.
Regulators worldwide mandate minimum liquidity thresholds for brokers. Where solvency ratios assess long-term debt sustainability, liquidity ratios are the first thing examiners check. Meeting them is a daily compliance requirement.
The right ratio depends on your business model. A 0.8 quick ratio is workable if your client base is institutional and withdrawals are predictable. On a retail crypto exchange, where users withdraw at the first sign of volatility, that same number puts you at serious risk.

Below 0.5 signals low liquidity and a high risk of failing to meet sudden obligations. 0.5 to 1.0 means things are tight but manageable, assuming you have highly predictable cash flows. 1.0 to 1.5 is generally a healthy, adequate buffer for normal operations and moderate volatility. Above 2.0 is strong, but an exceptionally high ratio can indicate your company's liquidity is sitting idle instead of being deployed productively.
If you want to dive into the economic theory behind why firms hoard cash versus investing it, read up on liquidity preference theory.
Upgrade To Prime-of-Prime Liquidity
Connect your brokerage to top-tier providers and diversify your funding mix with our aggregated multi-asset liquidity infrastructure.
Practical Ways to Improve Your Liquidity Position
Liquidity metrics only matter if they drive action. When your numbers look bad, address the root cause rather than waiting for conditions to improve.
Strengthen Funding Mix
Relying solely on retail client deposits is a single point of failure. Prime-of-prime relationships give you access to deeper capital pools and better margin terms. Strong ratios also signal creditworthiness to lenders evaluating your credit facilities.
Streamline Settlement Cycles
Faster settlement directly improves your ratios. Moving from T+2 to T+1 or same-day settlement frees up capital that would otherwise sit trapped in transit. If manual reconciliation steps are slowing the release of funds, that delay costs you liquidity every single day.
Implement Real-Time Risk Limits
Automated pre-trade checks act as a firewall against sudden margin breaches and counterparty failures, throttling transactions that exceed your risk thresholds before they drain your liquidity.
Deep, Reliable Liquidity Across 10 Major Asset Classes
FX, Crypto, Commodities, Indices & More from One Single Margin Account
Tight Spreads and Ultra-Low Latency Execution
Seamless API Integration with Your Trading Platform

Manual calculations on a Friday spreadsheet are stale before the file is saved. In brokerage and exchange environments, a liability position can gap out in ten minutes during a rate decision. That lag is the difference between catching a problem early and discovering it too late.
Integrated platforms fix this by pulling live numbers from your trading systems and payment gateways directly, cutting out manual reconciliation. That means your risk committee gets an accurate liquidity snapshot on demand, early enough to act before a deteriorating ratio becomes a crisis.
When your infrastructure connects liquidity aggregation directly to back-office accounting, your risk team stops relying on Friday spreadsheets and starts working with live numbers.
Strengthen Your Liquidity Infrastructure With B2BROKER
Liquidity ratios are foundational indicators of a company's financial health and a key input in any credit review. But a healthy balance sheet takes accurate data and infrastructure that enforces risk controls without manual intervention.
Getting those systems in place before a volatile period is what separates firms that manage through market stress from those that discover problems after the fact.
B2BROKER provides the end-to-end infrastructure necessary to manage and improve your liquidity. B2BROKER covers the full stack: liquidity aggregation, trading platforms, and back-office systems built to monitor your exposure in real time. Whether you need deep institutional access or a complete turnkey platform, the technology is there to keep your ratios healthy and your business online.
Keep Your Liquidity Ratios Bulletproof
Deploy our proven institutional stack and automate your risk management before the next severe market downturn hits.
Frequently Asked Questions about Liquidity Ratios
- What is meant by a liquidity ratio?
A liquidity ratio is a financial metric showing whether your company can pay short-term bills using easily convertible assets. It tells brokerages if they can cover sudden client withdrawals without taking an emergency loan.
- What does a liquidity ratio of 1.5 mean?
It means your firm holds a dollar and fifty cents in liquid assets for every single dollar it owes. While this buffer is healthy for traditional businesses, volatile exchanges often require a much higher baseline to operate safely.
- How do you calculate a net liquidity ratio?
You divide your specific short-term assets by your current liabilities using reconciled, real-time data. The exact asset mix changes depending on which specific stress test you want to apply to your balance sheet.
- How often should a brokerage recalculate these numbers?
You should run these calculations daily as an absolute minimum baseline. However, volatile trading sessions require intraday monitoring because your liability position can change drastically within just a few hours.
- Can technology platforms automate this reporting?
Yes, integrated infrastructure directly pulls live data from your payment gateways and trading systems. This real-time automation eliminates spreadsheet errors and allows your risk team to catch funding shortfalls instantly.