Best MetaTrader 4 Indicators Every Trader Should be Aware of

This article will help answer the questions of what MT4 indicators are, what types of indicators exist, and which are the best ones to use within the framework of electronic trading in the capital markets.
MetaTrader 4 (MT4) is one of the most universally trusted trading software programs used by both beginners and professional traders all over the world, and its quality is time-tested. Its appeal lies in its powerful charting tools, automated trading capabilities and a wide range of indicators available for technical analysis, allowing you to analyse market conditions, predict price movements and make informed trading decisions to determine your trading performance.
Metatrader 4 indicators are highly specialised mathematical models built to detect and track market activity or price trends to form certain conclusions regarding their characteristics and patterns.
Key Takeaways
- MT4 indicators are professional analytical tools designed with all the advantages of the MetaTrader ecosystem in mind.
- One of the most widely used technical indicators in trading is MACD.
- In practice, traders always use a combination of different indicators to achieve the desired results when analysing asset price characteristics.
What Are MetaTrader 4 Indicators?
MetaTrader 4 indicators are technical analysis tools used within the trading platform to assist traders in making deliberate trading decisions based on particular trading circumstances and preferences. These indicators analyse price movements, volume, and other market data to provide insights into potential future price trends and market conditions. They also enable traders to employ price action strategies to gain a deeper insight into market activity and anticipate potential price movements in any particular trading asset.
Any kind of measure with a value obtained from the movement of a currency pair’s price or another financial asset is referred to as an MT4 indicator. Traders use these indicators as part of technical analysis to forecast future price levels or the general price trend of a specific security by examining past patterns or market performance.
Trading indicators are unique because they do not consider fundamental factors which influence prices, such as trading volume, volatility, slippage, liquidity level, etc. Technical indicators, which are specifically designed to analyse and identify short-term price movements, are favoured by active traders on all markets, especially Forex.
Several of the most effective indicators for MT4 display their findings directly on an asset’s price chart. This simplifies the analyst’s task when comparing the MT4 indicators with the market price. Other types of the most effective MT4 indicators, like oscillators, present their findings in a separate window.
Most long-term traders or investors don’t place significant emphasis on technical indicators. This is because these indicators don’t provide substantial information about the fundamental factors that can impact prices. Nevertheless, long-term traders can still take advantage of technical indicators, as they can assist in identifying optimal entry and exit points by analysing long-term trends.
The principles of technical analysis are based on centuries of financial market data. Some aspects of technical analysis first appeared in Amsterdam in the 17th century and later evolved in Asia during the 18th century, leading to the development of candlestick techniques.
What Are the Types of Technical Indicators?
Today, the MetaTrader trading ecosystem offers the widest range of indicators for analysing different types and methods of application. Each has its own advantages, disadvantages, and peculiarities of use that affect the implementation of a particular trading strategy.

A wide list of technical indicators is divided into groups and ranked by the method of tracking price movement, trend or any other characteristic inherent in changing the price of any asset. Among them are the following:
Trend Indicators
Trend indicators play a crucial role in technical analysis by examining past price data to determine the overall trend of the market. This allows traders to anticipate potential future price movements and make more informed decisions. By identifying whether an asset is trending upwards, downwards, or moving sideways, trend indicators provide valuable insight into the market’s direction.
The primary purpose of trend indicators is to help traders recognise the dominant direction of the market. This involves identifying whether the market is experiencing an upward, downward, or sideways trend. By doing so, traders can gain a better understanding of the market’s behaviour and adjust their trading strategies accordingly.
In addition to identifying trends, trend indicators also assist traders in pinpointing optimal entry and exit points for their trades. By analysing the identified trend, traders can make more informed decisions about when to enter or exit the market, ultimately improving their trading outcomes. This highlights the practical significance of trend indicators in guiding traders towards more effective trading strategies.
Momentum Indicators
Momentum indicators are essential tools in technical analysis that measure the speed and magnitude of price movements. By evaluating how quickly prices fluctuate within a specific timeframe, they assist traders in determining the intensity of a trend and possible turning points.
By utilising momentum indicators, traders can gain valuable insights into market dynamics and make deliberate decisions based on the analysis of price movement speed. These indicators are instrumental in identifying trends and potential shifts in market direction, providing traders with a comprehensive understanding of price behaviour.
Volume Indicators
Volume indicators are instruments utilised in technical analysis to quantify the volume of assets traded during a specific period. By examining trading volume, these tools offer valuable information regarding the intensity and direction of price movements. Traders can utilise volume indicators to validate trends, pinpoint possible reversals, and identify buying or selling pressure in the market.
The primary purpose of volume indicators is to confirm trends by assessing whether volume aligns with price movements, thus validating the strength of a trend. Additionally, these tools help traders identify potential trend reversals by recognising inconsistencies between volume and price movements.
Have a Question About Your Brokerage Setup?
Our team is here to guide you — whether you're starting out or expanding.
Volume indicators enable traders to measure the level of buying or selling pressure in the market, providing valuable insights for making informed decisions on entry and exit points.
Volatility Indicators
Volatility indicators are essential instruments in technical analysis, designed to evaluate the speed and extent of price changes within financial markets. By analysing these indicators, traders gain valuable insights into the fluctuations of price levels over time, which aids in understanding market dynamics and enhances the decision-making process regarding trades.
These indicators fulfil several vital functions, including quantifying market risk associated with price variations. They help traders discern whether the market is characterised by high volatility, indicating potential for substantial price shifts, or low volatility, suggesting more stable price behaviour. Additionally, volatility indicators assist in formulating trading strategies tailored to the prevailing volatility conditions.
Sentiment Indicators
Sentiment indicators serve as valuable tools in financial markets. They offer insights into the overall sentiment of investors and traders toward specific assets or the market in its entirety. These metrics help determine whether the prevailing sentiment is bullish or bearish, enabling traders to make well-informed decisions based on market sentiment.
The primary purpose of sentiment indicators is to gauge the mood of market participants, providing a glimpse into their emotions and attitudes that can impact market movements. Additionally, these indicators aid in predicting potential price reversals by identifying extreme levels of optimism or pessimism in sentiment.
Breadth Indicators
Breadth indicators evaluate the market’s overall strength by examining the participation levels of various assets in a specific trend or movement. By analysing these indicators, traders gain valuable insights into the market’s internal dynamics, allowing them to discern whether a market rally or downturn is broadly supported or confined to a select few stocks. This analysis is crucial for understanding the underlying health of market movements.
The primary function of breadth indicators is to assess market vitality by measuring the number of advancing assets versus declining assets, thereby providing a clearer picture of the market’s direction and strength.
Additionally, these indicators are instrumental in identifying potential divergences, which can signal impending market reversals by highlighting inconsistencies between major market indices and overall stock participation.
Support and Resistance Indicators
Support and resistance indicators help traders identify critical price levels where assets find support or encounter resistance. The primary purposes of support and resistance indicators include identifying key price levels where buying or selling pressure is expected to emerge, predicting potential price movements based on historical price behaviour at these levels, and developing effective trading strategies. Traders can use these indicators to set stop-loss or take-profit levels and adjust their trading strategies accordingly to capitalise on market trends.
Pattern Recognition Indicators
Pattern recognition indicators are designed to pinpoint and evaluate recurring price formations on financial charts. These tools assist traders in identifying specific patterns that frequently signal impending market shifts, thereby offering valuable insights into potential future price actions.
The primary aim is to identify patterns that have historically resulted in particular price movements, which can assist in forecasting future trends. Additionally, these indicators enhance decision-making by providing context for trading choices grounded in historical pattern behaviour.
Top 10 Best MetaTrader 4 Indicators
The MetaTrader platform has come a long way from its infancy to professional software that provides an optimal combination of necessary features and tools for comfortable work on financial markets, including a countless list of analytical indicators that help analyse market trends and formations. The list of best trading indicators MT4 includes the following:
1. Moving Averages (MA)
Moving Averages (MA) are a popular tool used in technical analysis to smooth out price data and identify trends in the market. The main purpose of moving averages is to provide traders with a clearer view of the direction of the trend and potential support or resistance levels.
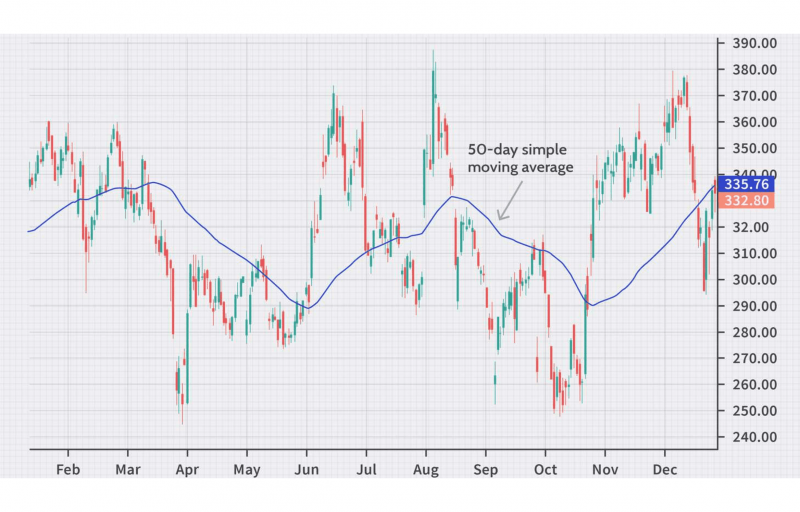
There are two main types of moving averages:
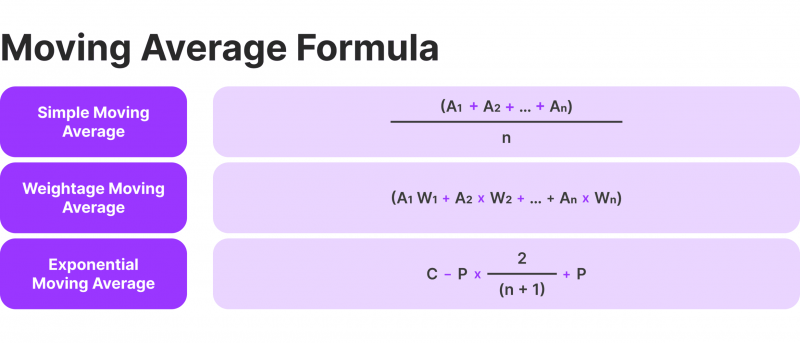
Simple Moving Average (SMA): This type calculates the average of prices over a specified period, providing a smooth line that indicates the general direction of the trend.
Exponential Moving Average (EMA): The EMA gives more weight to recent prices, making it more responsive to current price changes compared to the SMA. This means that the EMA reacts more quickly to price movements, which can be advantageous in fast-moving markets.
2. Relative Strength Index (RSI)
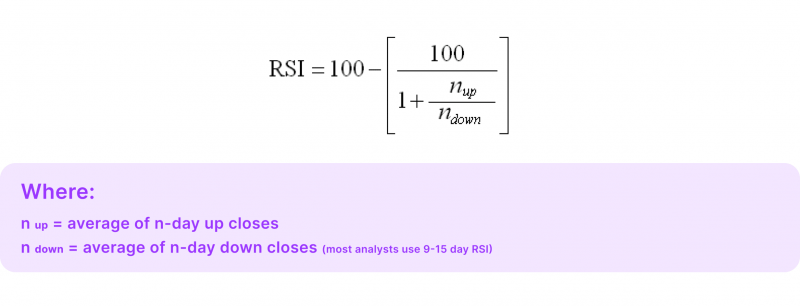
The Relative Strength Index (RSI) is a momentum oscillator that measures the speed and change of price movements on a scale of 0 to 100. Developed by J. Welles Wilder, it is used to evaluate the strength of a security’s recent price performance relative to its past performance.
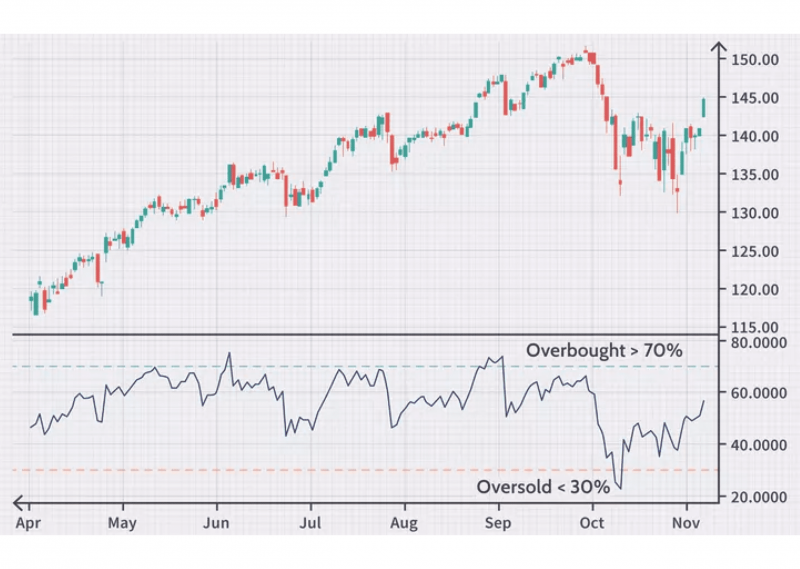
The RSI helps traders identify conditions where an asset might be overbought or oversold, indicating potential reversal points in the market.
Typically, an RSI reading above 70 suggests that the asset may be overbought and could be due for a price decline or correction. Conversely, an RSI reading below 30 implies that the asset may be oversold and could be poised for a price increase.
3. Moving Average Convergence Divergence (MACD)
The Moving Average Convergence Divergence (MACD) is a versatile and widely used technical indicator that helps traders identify changes in the strength, direction, momentum, and duration of a trend in a stock’s price. Developed by Gerald Appel in the late 1970s, the MACD combines aspects of both trend-following and momentum indicators to provide a comprehensive view of the market.
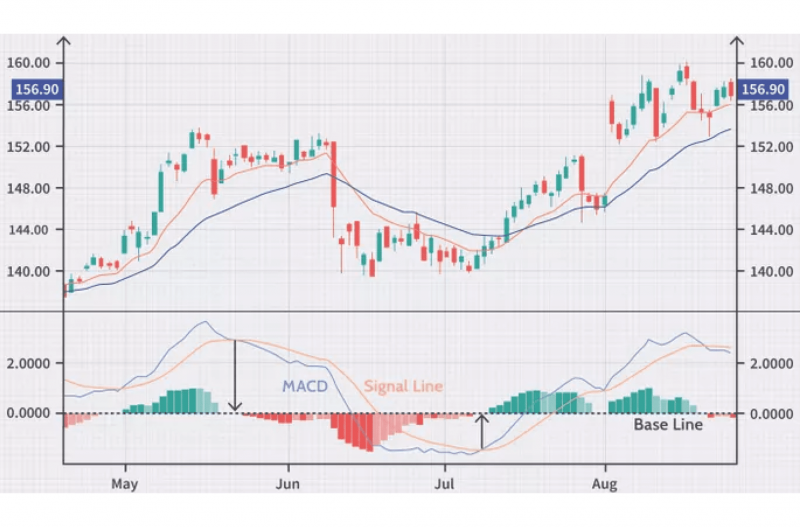
Key components of the indicator are:
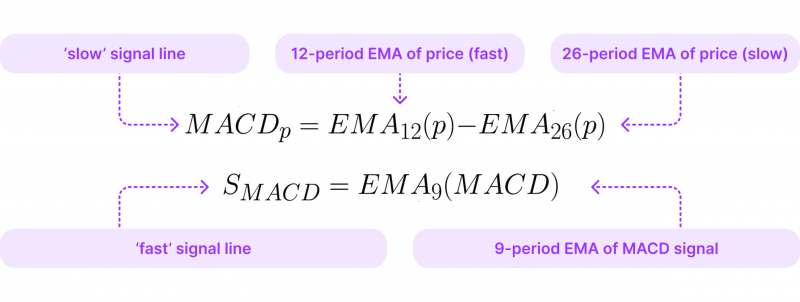
MACD Line: This is the difference between the price’s 12-day and 26-day Exponential Moving Averages (EMAs). It is the core component of the MACD and reflects the trend’s direction and momentum.
Signal Line: A 9-day EMA of the MACD Line. The Signal Line generates buy or sell signals. When the MACD Line crosses above the Signal Line, it suggests a potential buy signal, and when it crosses below, it indicates a potential sell signal.
MACD Histogram: This shows the difference between the MACD Line and the Signal Line. The histogram visually represents the convergence and divergence between these two lines, helping traders gauge the strength and direction of the trend. Positive bars indicate that the MACD Line is above the Signal Line, while negative bars indicate below.
4. Bollinger Bands
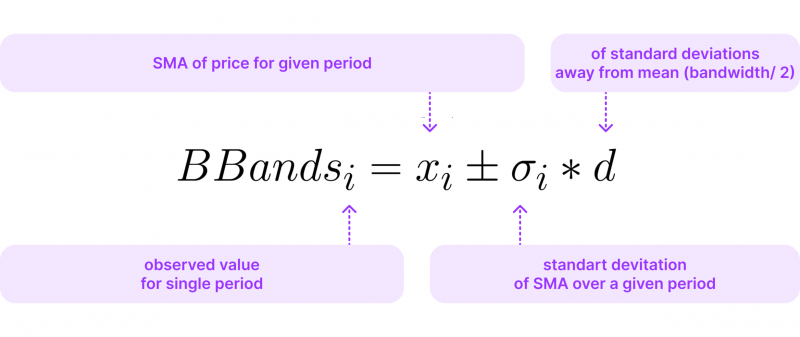
Bollinger Bands are a technical analysis tool focused on volatility, created by John Bollinger in the early 1980s. They serve to pinpoint overbought or oversold market conditions while also evaluating the volatility and potential price movements of various financial instruments. The structure of Bollinger Bands includes three distinct lines on a price chart, which provide critical insights into market behaviour.
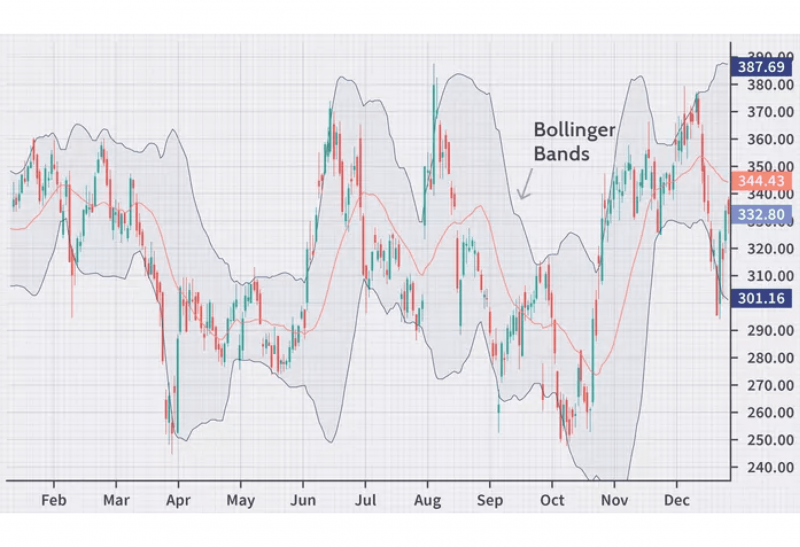
The central line, known as the Middle Band, is typically represented by a 20-day Simple Moving Average (SMA) of the asset’s price, reflecting the average price over a designated timeframe. The Upper Band is derived by adding a set number of standard deviations — commonly two — to the Middle Band, indicating potential resistance and signalling overbought scenarios. Conversely, the Lower Band is calculated by subtracting the same number of standard deviations from the Middle Band, highlighting potential support and identifying oversold conditions.
5. Fibonacci Retracement
Fibonacci retracement is a valuable technical tool utilised in financial analysis to pinpoint possible support and resistance levels within an asset’s price movements. This method is based on the Fibonacci sequence, a numerical series in which each number is the sum of the two preceding numbers. By applying key ratios derived from this sequence, traders can anticipate potential reversal points in the asset’s price trends.
The primary Fibonacci retracement levels commonly used in technical analysis include 23.6%, 38.2%, 50%, 61.8%, and 76.4%. These levels are calculated by measuring the vertical distance between a high and low point on the price chart and then applying these ratios to identify areas where the price may retrace before continuing its original trajectory.
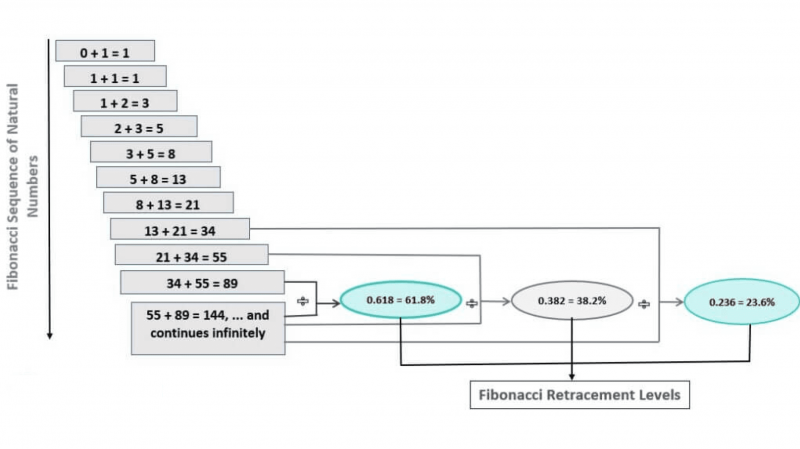
Traders can effectively apply Fibonacci retracement by identifying significant peaks and troughs on a price chart, plotting Fibonacci levels between these points, and utilising the resulting horizontal lines to indicate potential support and resistance levels for price corrections.
Discover the Tools That Power 500+ Brokerages
Explore our complete ecosystem — from liquidity to CRM to trading infrastructure.
6. Stochastic Oscillator
Stochastic oscillator is a widely utilised momentum indicator in technical analysis that assesses the closing price’s position relative to its price range over a designated timeframe. This tool, created by George Lane in the late 1950s, aims to pinpoint overbought and oversold market conditions, thereby offering potential signals for buying and selling opportunities.
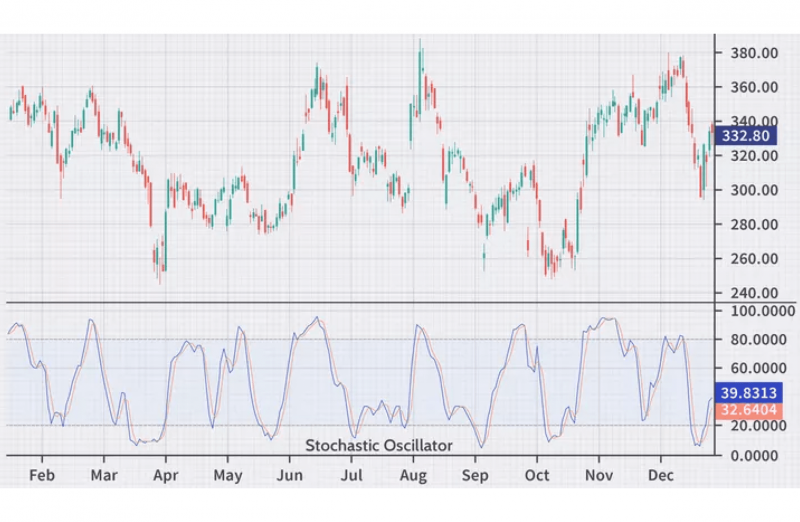
The primary component of the stochastic oscillator is the %K line, which indicates the current closing price about the high-low range over a specified number of periods, typically 14 days. The calculation for the %K line is expressed as a percentage, using the current closing price, the lowest price over the past ‘n’ periods, and the highest price over the same duration.
Additionally, the %D line is a smoothed moving average of the %K line, generally calculated over a three-period average. It generates trading signals by further validating the %K line’s movements.
7. Average True Range (ATR)
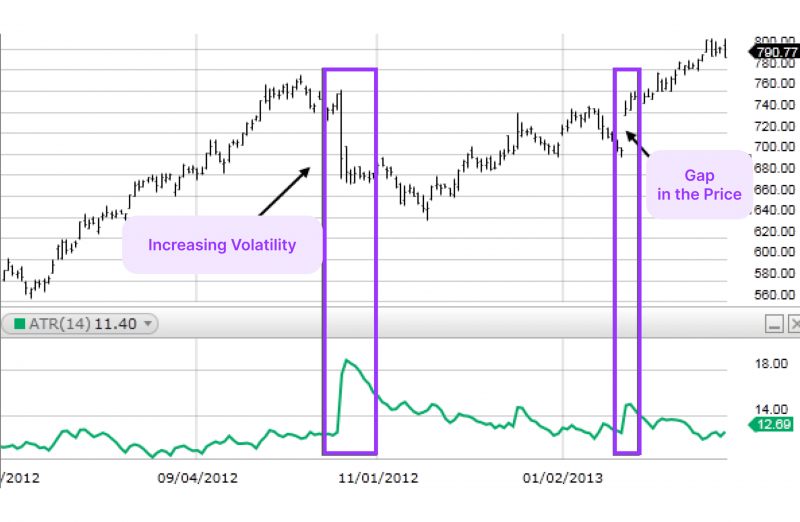
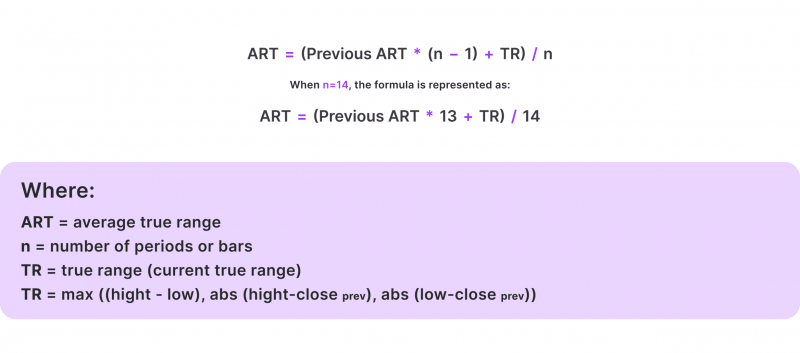
The Average True Range (ATR) serves as a volatility indicator in technical analysis, quantifying the extent of price movement or volatility of a financial asset over a defined timeframe. Introduced by J. Welles Wilder in his 1978 publication “New Concepts in Technical Trading Systems,” the ATR provides traders with insights into the typical price fluctuations of an asset, thereby aiding in the establishment of stop-loss orders and the identification of optimal entry and exit points for trades.
8. Parabolic SAR (Stop and Reverse)
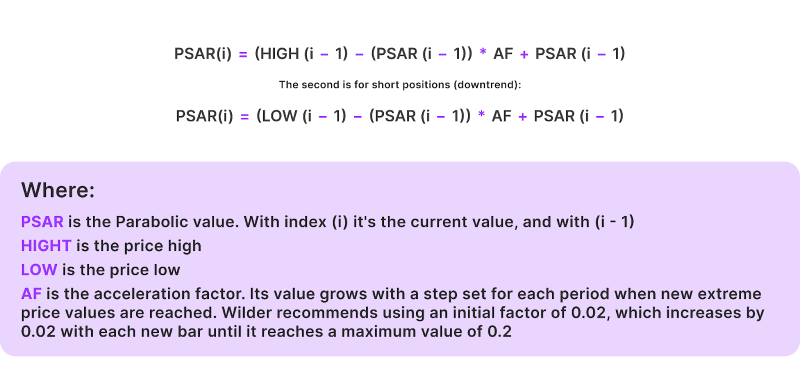
The Parabolic SAR, which stands for Stop and Reverse, is a trend-following tool created by J. Welles Wilder and first presented in his 1978 publication “New Concepts in Technical Trading Systems.” This indicator is designed to signal potential reversal points in an asset’s price movement, thereby assisting traders in determining the prevailing trend and identifying moments when a shift in that trend may occur.
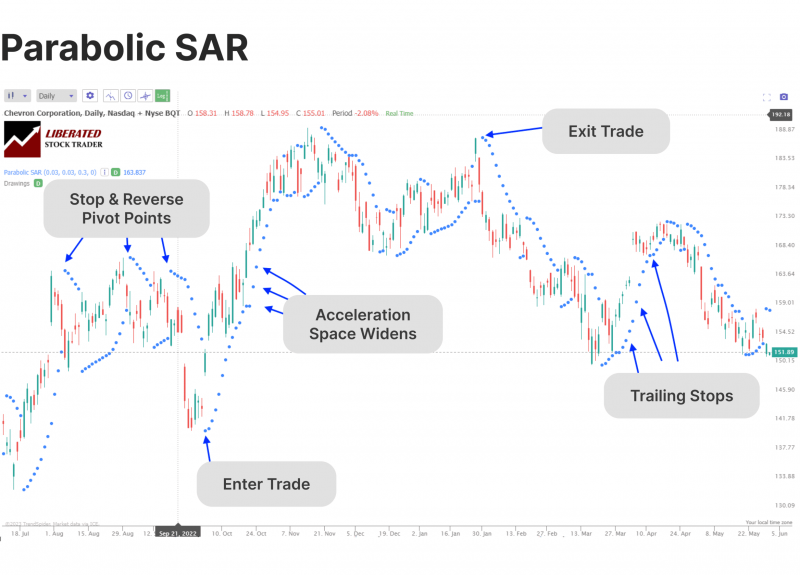
The Parabolic SAR’s core feature is its plotted values, represented as dots on the price chart. These dots indicate the anticipated direction of price movement: during an uptrend, the dots appear below the price, suggesting bullish momentum, while in a downtrend, they are positioned above the price, indicating bearish conditions.
9. Ichimoku Cloud
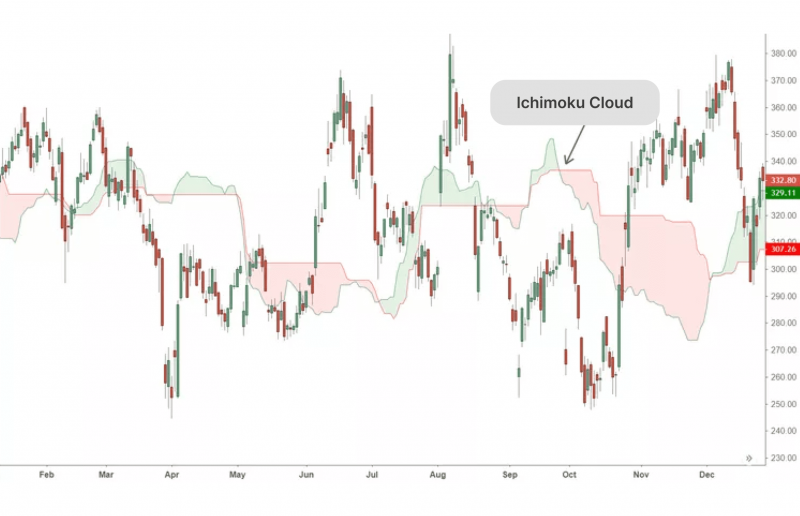
The Ichimoku Cloud, also called Ichimoku Kinko Hyo, is an extensive trend-following tool utilised in technical analysis to offer a quick overview of an asset’s trend, momentum, and possible support and resistance levels. Created by Goichi Hosoda in the 1960s, this indicator presents a comprehensive market perspective by integrating various components into one chart.
10. Williams %R
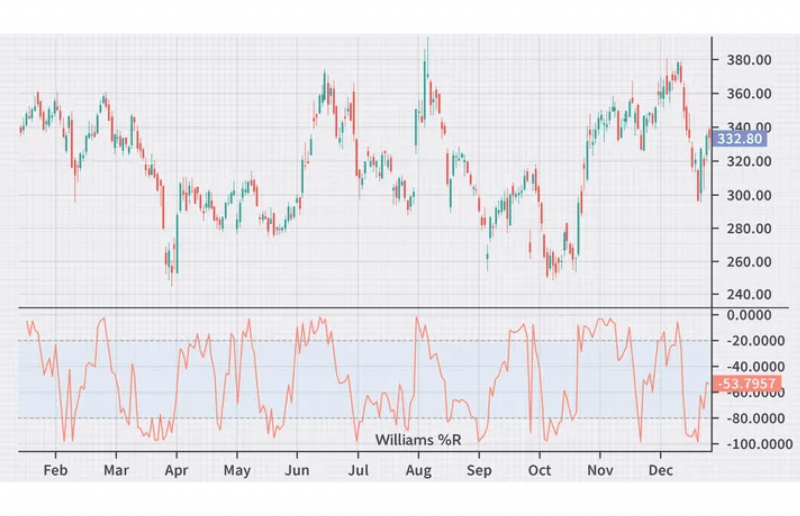
The Williams %R indicator, created by Larry Williams, is a momentum oscillator used in technical analysis to gauge the closing price’s position in relation to the high-low range during a set timeframe. Its purpose is to pinpoint overbought and oversold situations within a market, aiding traders in identifying possible reversal points. This indicator is commonly depicted as a line chart, fluctuating between 0 and -100.
Conclusion
Technical indicators of the MT4 platform are an integral part of any market participant’s investment activity. They form a foundation for building a profitable investment strategy and help analyse market sentiments, trends, and formations.
Each indicator has its own peculiarities and helps analyse characteristics in separate market conditions, so it makes sense to use a combination of different indicators and other analytical tools to increase the efficiency of analysis.
FAQ
What are the most commonly used MT4 indicators?
The most commonly used MT4 indicators are Moving Averages, MACD, RSI, Stochastic Oscillator, Bollinger Bands, and Fibonacci Retracement.
How do I choose the best indicators for my trading strategy?
The best indicators depend on your trading style, market conditions, and the information you want to extract from the market. It’s recommended that you experiment with different indicators to find the ones that work best for your trading approach.
Can I use multiple indicators at the same time?
Yes, combining indicators can provide a more comprehensive market analysis. However, it is essential not to overload your charts, as too many indicators can lead to confusion and contradictory signals.
How do I customise the settings for the indicators?
Most indicators have adjustable parameters, such as the number of periods used for the calculation. You can experiment with different settings to find the best for your trading strategy.
Are there any free or paid MT4 indicator resources available?
Yes, there are many free and paid indicator resources available for MT4. Some popular sources include the MetaTrader Market, the MQL5 Community, and various trading forums and websites.
How do I add indicators to my MT4 platform?
To add an indicator to your MT4 platform, you can simply drag and drop the indicator from the Navigator window onto your chart or right-click on the chart and select “Indicators” to access the available indicators.
Can I create my own custom indicators for MT4?
MT4 allows you to create custom indicators using the MQL4 programming language. This can be a more advanced process but will enable you to tailor the indicators to your trading needs.


