RSI vs MACD: Which Indicator is Better for Your Trading Strategy?

In trading and investing, the right tools are essential for success. Among the many indicators available, the RSI and MACD have proven effective for monitoring market movements. A study analysing the Milan Comit General and the S&P/TSX Composite Index found that the MACD (12,26,0) and RSI (21,50) can produce strong returns in certain markets, proving their value.
But which is better? Should traders prioritise one, or do they work best together? This article will compare RSI vs MACD and break down their differences, strengths, weaknesses, and practical applications to help you navigate the markets more effectively.
Key Takeaways
- The RSI indicator tends to show its strength in spotting overbought/oversold levels if markets are stuck in a range.
- The MACD indicator, however, is often better for confirming a trend’s direction and its momentum when markets are clearly moving one way.
- Combining RSI vs MACD might give a fuller market picture. This approach can also help filter out some false signals from either indicator alone.
What Is the RSI Indicator?
J. Welles Wilder developed the Relative Strength Index (RSI indicator) back in the late 1970s. It’s a type of momentum oscillator. What it does is measure how fast and how much prices are changing, showing this on a 0 to 100 scale. Traders use this. Why? To spot times when an asset could be overbought or perhaps oversold.
The RSI is computed using the formula:

Where:
RS represents the average gain divided by the average loss, usually calculated over a 14-day period.
To illustrate: should a stock rise consistently for 14 days, its RSI value would likely approach 70, which suggests it might be overbought. If the stock instead falls, the RSI value would drop towards 30, signalling a potentially oversold market condition.
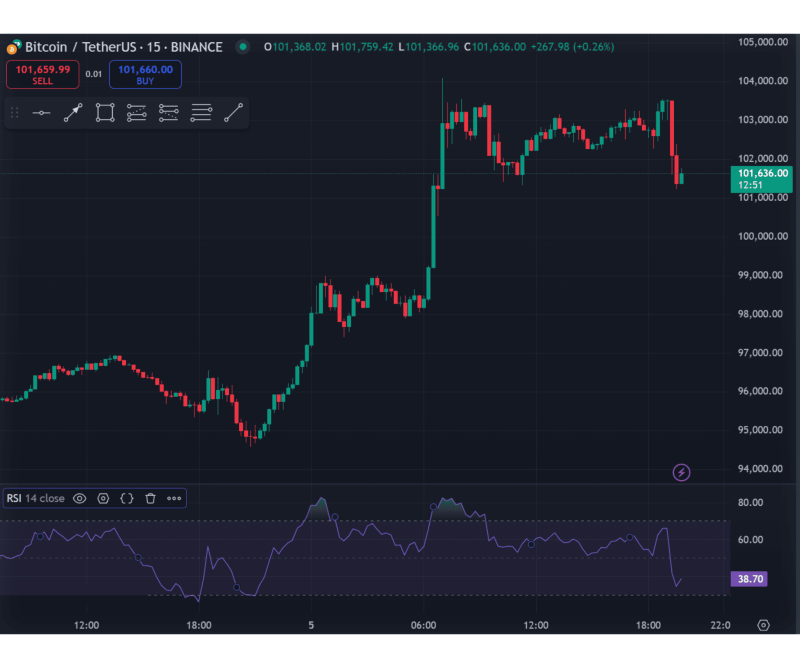
Key Features of the RSI
The RSI indicator is a common oscillator providing traders with insights into market conditions and potential price reversals. Its key features merit a detailed look.
Key Levels for Price Analysis
A core function of the RSI indicator is highlighting price zones that might signal significant market shifts:
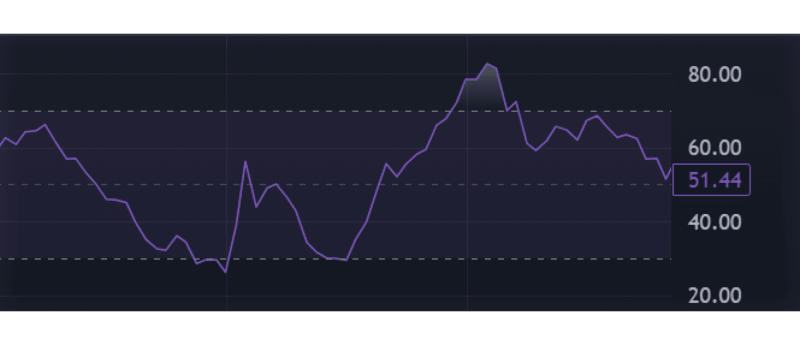
- Above 70: An RSI reading above this level often means the asset’s price has risen quickly. This could suggest a pending correction or reversal, prompting some traders to consider selling or short positions.
- Below 30: When the RSI value drops below 30, it usually indicates the asset’s price has fallen sharply and might be poised for a recovery. Many traders see this as a potential buying signal.
These levels are not definitive rules. In strongly trending markets, for instance, the RSI can stay in overbought or oversold territory for prolonged periods. They do, however, offer useful initial reference points for analysis.
Divergence
Identifying RSI divergence against price action is another critical use of this indicator. Such divergences frequently signal potential trend reversals.
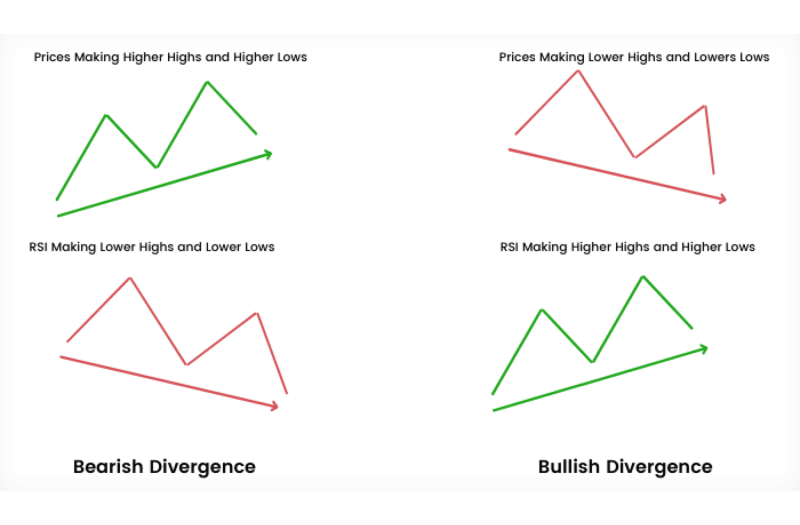
- Bullish Divergence: Price hits new lows, but the RSI indicator starts making higher lows at the same time. What does it mean? Selling pressure could be drying up.
- Bearish Divergence: Price makes new highs, yet the RSI indicator can’t keep up; it forms lower highs. This often signals that buyers are losing steam. Such a pattern can be an early warning of a potential downtrend.
While RSI divergence can be a strong signal, it is not infallible. Confirmation through other analytical tools or indicators is always a prudent step.
Strengths of RSI
The RSI indicator is popular for good reasons: it’s versatile and generally easy to use. Its main advantages include:
- Simplicity for Beginners: The RSI is an accessible tool, even for traders new to technical analysis. Its clearly defined thresholds and visual representation make it easy to understand and apply.
- Ideal for Overbought/Oversold Identification: Not many indicators can match the RSI when it comes to spotting potential price reversals. That’s why it works especially well when a market is stuck in a range, with prices bouncing up and down.
- Effective in Range-Bound Markets: The RSI truly comes into its own when there’s no strong market trend. It can help traders catch those price swings back and forth within a range, aiming to profit from smaller moves.
The RSI is a solid tool, no doubt. But how well it works really depends on the situation and the trader’s approach. To get the most out of it, confirming its signals with other tools or analysis is always a smart move.
What Is the MACD Indicator?
The Moving Average Convergence Divergence (MACD indicator), born from Gerald Appel’s work in the 1970s, also tracks momentum. But it’s different from the RSI. The MACD indicator looks at how multiple moving averages of a price relate to each other. This makes it a strong choice for traders who follow trends.
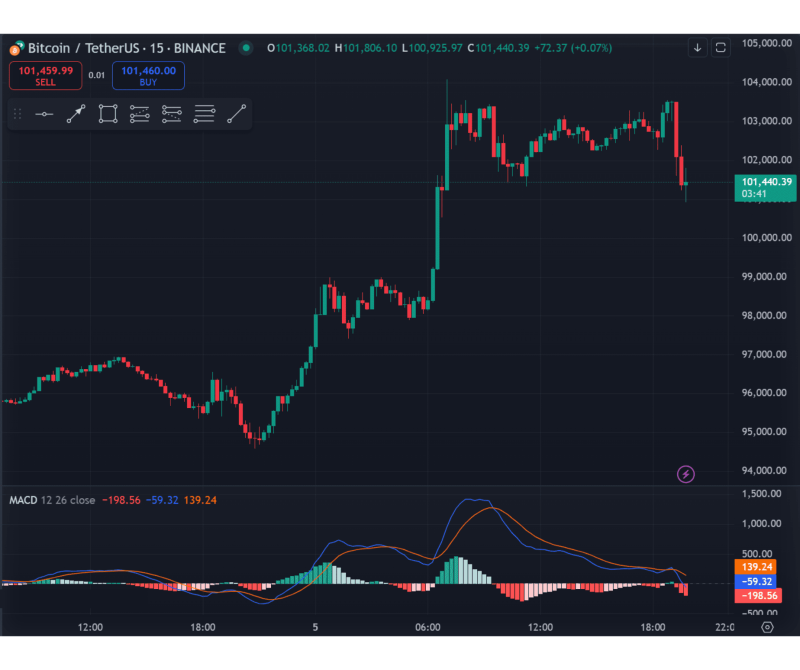
The MACD consists of three components:
Have a Question About Your Brokerage Setup?
Our team is here to guide you — whether you're starting out or expanding.
- MACD Line: This is the core of the MACD formula. You get this line by taking the 12-period Exponential Moving Average (EMA) and subtracting the 26-period EMA from it.
- Signal Line: A 9-period EMA of the MACD line.
- Histogram: The gap between the MACD and the signal lines.
Key Features of the MACD
The MACD indicator is quite versatile; it gives traders a read on both market trends and their underlying momentum. One of its main signals is worth a closer inspection:
Crossovers
Crossovers are among the most straightforward and widely used signals provided by the MACD. These occur when the MACD line interacts with the signal line:
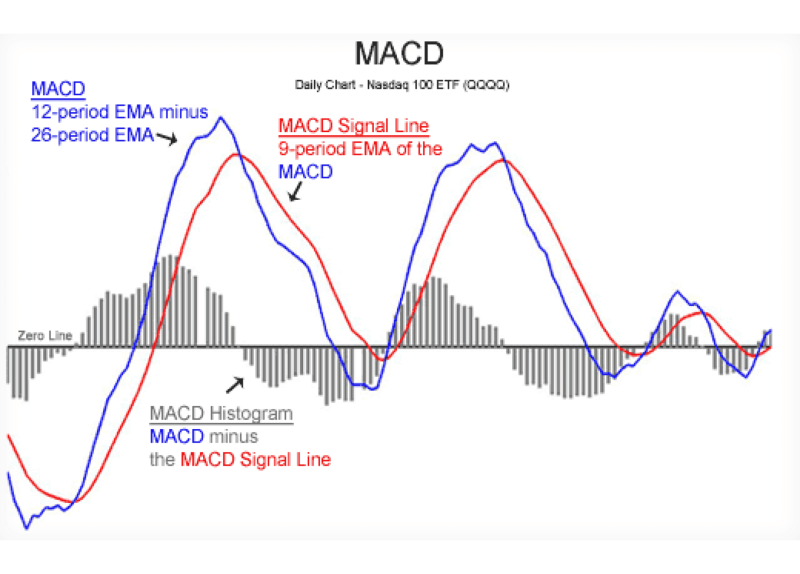
- Bullish Signal: The MACD line crosses above the signal line. The market could be starting an uptrend. Many traders take this as a cue to consider buying.
- Bearish Signal: Now, the MACD line dips below the signal line. This can point to the market heading south. For many traders, that’s a signal to think about selling.
These signals work best when paired with other tools or when you also consider the broader market trends for confirmation.
Histogram Peaks and Troughs
The MACD indicator’s histogram shows you the gap between the MACD line and the signal line. Look at its peaks and valleys; they tell a story.
- Histogram bar height: That shows trend strength. Big bars mean strong momentum. Small bars suggest it’s fading.
- Shrinking Bars: That can be a warning. The trend might be running out of steam, maybe a reversal is coming.
- Growing Bars: That often means momentum is building. The current trend probably has more room to run.
Many traders use the histogram as an early warning. This is especially true if its shape starts to shift before the price itself makes a big move.
Divergence
When the MACD indicator and the price don’t align, that’s a MACD divergence:
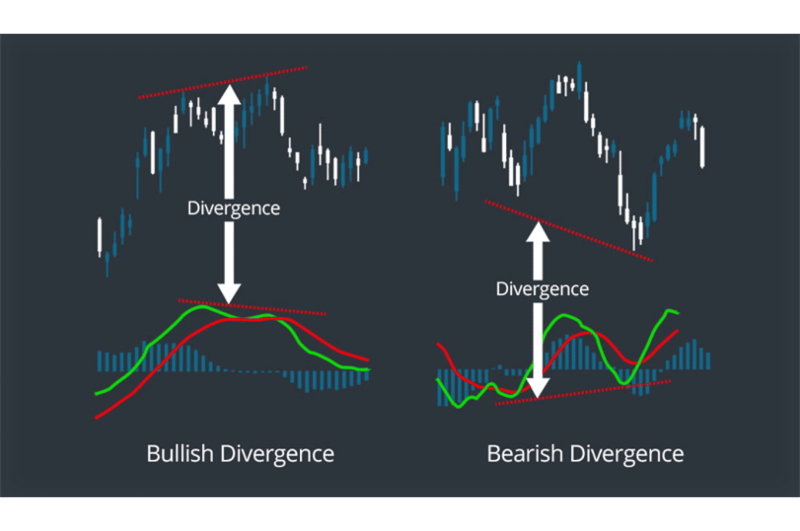
- Bullish Divergence: Price shows lower lows, but the MACD shows higher lows. This means bearish momentum is weakening, and the market could turn upward.
- Bearish Divergence: Price displays higher highs, but the MACD shows lower highs. This indicates that bullish momentum is fading, and the market might turn downward.
Divergences are a powerful tool, but should be validated using additional indicators or methods for greater reliability.
Strengths of the MACD
The MACD is a favoured tool among traders for several reasons:
- Combination of Trend and Momentum Analysis: The MACD indicator gives you a read on where the trend is heading and how strong the momentum behind it is.
- Effective in Trending Markets: Some indicators get confused when a market is strongly trending. MACD excels here, helping traders spot a solid trend and ride it with more conviction.
- Added Insight from the Histogram: Еhe MACD histogram acts like a second opinion, often showing subtle shifts in momentum before the price itself reacts.
These points explain why the MACD indicator is often a first choice for traders. They use it to find and make the most of opportunities when markets are clearly trending.
How to Use the MACD
Most traders watch for a few key things when applying MACD:
Leverage MACD Line Crossovers
Watch for bullish crossovers (MACD line crossing above its signal line) to help identify buying opportunities. Bearish crossovers (MACD line crossing below its signal line) can signal potential selling points.
Monitor the Histogram for Momentum Shifts
Note changes in the histogram’s size and configuration. These can offer early indications of possible trend reversals or shifts in momentum.
Add Other Indicators
Although the MACD indicator is a potent tool, its signals can gain reliability when confirmed by complementary indicators, such as the RSI.
RSI vs MACD: Key Differences
Both the RSI indicator and the MACD indicator are valuable tools for traders. But they have several differences.
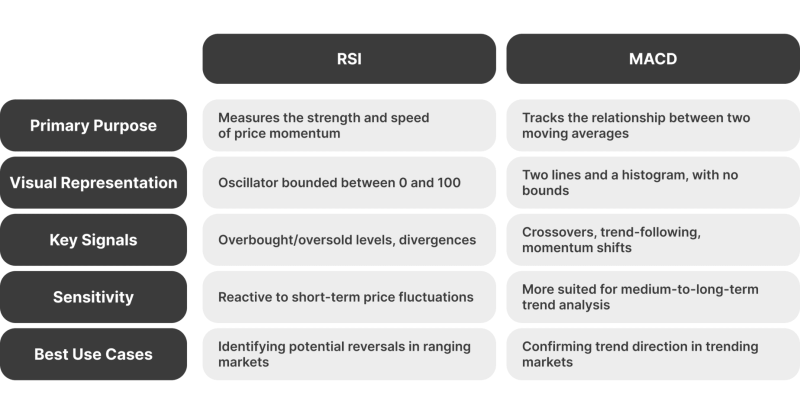
- Purpose and Functionality: What does the RSI indicator do? It mostly tracks momentum. It gives traders hints about when a price might turn. The MACD indicator is different. It looks at how two moving averages interact. That makes it generally better for seeing the bigger market trend.
- Visual Layout and Ease of Use: The RSI presents as a bounded oscillator (0–100), which is fairly direct and visually clear. New traders usually get the RSI quickly. MACD, though, with its two lines and a histogram, can look more complicated.
- Performance in Different Market Conditions: The RSI indicator usually shines when the market is stuck in a range, and prices just bouncing between support and resistance. That’s when it’s good at spotting potential reversals. The MACD indicator, on the other hand, often works better when the market is clearly trending. It helps traders see if a trend still has power and follow it.
RSI vs MACD: Which Is Better?
It really depends on what you’re trying to do and the kind of market you’re looking at. A few pointers:
Use RSI When:
- You’re trading short-term moves or quick reversals.
- The market is moving sideways, not strongly trending.
For example, if a stock keeps bouncing between support and resistance levels, RSI can help you spot when it could reverse.
Use MACD When:
- You’re trading a market with a clear trend (up or down).
- You need to check if a trend is real and how strong it is.
Example: A stock is climbing steadily. The MACD indicator can help you see if the upward momentum is holding up or if it’s losing steam.
Using RSI and MACD Together: A Winning Combination
RSI and MACD are powerful indicators alone. However, using them together will allow you to get a much clearer read on what the market is doing. This combination can help traders spot better trade setups and dodge some of the false alarms. How to do it right:
Start by using the RSI. A number above 70 suggests the market may have peaked and is due for a correction, while an RSI below 30 signals a potential rebound. This gives you an initial idea of whether the market might reverse.
Next, confirm the trend’s momentum with the MACD. Look for crossovers between the MACD line and the signal line—bullish ones suggest upward momentum, while bearish crossings signal downward trends.
The histogram can also provide clues: shrinking bars indicate weakening momentum while growing bars show strengthening trends. For example, if the RSI shows overbought conditions but the MACD histogram is still growing, it might be wise to wait before selling.
Finally, watch for divergences to strengthen your analysis. A bullish one takes place when the price makes lower lows, but the RSI or MACD shows higher lows, signalling a potential upward reversal. A bearish divergence, on the other hand, suggests the opposite. Combining RSI and MACD divergences provides extra confidence in your trade decisions.
Discover the Tools That Power 500+ Brokerages
Explore our complete ecosystem — from liquidity to CRM to trading infrastructure.
Example of a Trade
Imagine you’re analysing a stock, and here’s what you observe:
- RSI Indicates Oversold: The RSI indicator drops below 30. Such a reading often suggests the stock is oversold, and a rebound could be developing.
- MACD Confirms Momentum Shift: The MACD indicator might show a bullish crossover, where its line moves above the signal line. The histogram, in this case, would also typically start to grow.
- Price Aligns with Indicators: The price itself seems to agree. It shows signs of steadying after its recent drop.
This alignment of RSI and MACD signals suggests a strong buying opportunity. You enter a long position, believing both indicators confirm the potential for upward momentum.
Challenges of RSI and MACD: What Traders Need to Know
RSI and MACD are indeed strong tools, yet they are not without their imperfections.
Limitations of RSI
The RSI excels in identifying peak, bottom, and overbought/undersold levels, but it has some notable weaknesses:
- Sensitivity in Volatile Markets: When markets move rapidly, the RSI indicator can sometimes generate an excess of signals. Distinguishing genuine signals from market noise becomes challenging. As a result, traders could find themselves entering or exiting positions too early because of these misleading indications.
- Less Effective in Trending Markets: If a market shows a strong trend, the RSI indicator can stay in an extreme zone (overbought or oversold) for a long time, without any price reversal. This is why the RSI often gives clearer signals in range-bound markets, where prices tend to move back and forth between established levels.
Limitations of MACD
The MACD is highly effective for tracking trends and momentum, but it also has its drawbacks:
- Lagging Signals: The MACD indicator uses moving averages. This means it inherently reacts to price changes with some delay, only after they’ve happened. Because of this lag, traders might find themselves entering or exiting trades later than ideal. This can mean missing the early, often most profitable, segment of a price move.
- Struggles in Choppy Markets: When markets lack a clear direction (choppy conditions), the MACD indicator can produce unreliable or contradictory signals. Identifying a true trend becomes difficult. This can lead to trader frustration from “whipsaws”—situations where the MACD signals a trend, only for it to reverse quickly.

Shared Weaknesses of RSI and MACD
Beyond their specific drawbacks, both RSI and MACD have some shared overarching limitations. A key one: both tools use only past price data for their calculations. This means neither can predict future price moves with any guarantee.
Because they look only at past data, their signals become less dependable when markets change quickly. Sudden news or unexpected events can make their readings irrelevant almost instantly. Think of RSI and MACD as helpful guides, not as crystal balls. Always factor in the bigger market picture.
Conclusion
When comparing RSI vs MACD, there isn’t one single “better” tool. Each has its own pluses and minuses. Their effectiveness really depends on the specific market situation and how a trader applies them. For better trading outcomes:
- Assess the market conditions (range-bound vs. trending).
- Align the indicator with your trading goals (short-term scalping vs. trend-following).
- Experiment with using them together to avoid false signals and make better decisions.
If you learn how these indicators function and the best times to use each, you can apply RSI, MACD, or a combination with more confidence. This can lead to more informed trading decisions and help you navigate the financial markets’ challenges.
FAQ
Do professional traders use MACD?
Yes, professional traders use MACD because it helps them see trends and momentum clearly. It’s especially useful in markets where prices are moving in one direction.
What is better, MACD or RSI?
There’s no clear winner—it depends on what you’re trading and your goals. RSI identifies potential reversals, while MACD best confirms trends and momentum.
How to use MACD and RSI together?
Use RSI to find overbought or oversold zones and then check MACD to confirm if the trend supports a trade. This combination can help you avoid bad signals and make better decisions.
What indicator do most traders use?
Most traders rely on moving averages (MA and EMA) to identify trends, while the RSI and MACD confirm trends and reversals. Additional favourites like Bollinger Bands and Fibonacci Levels are valued for analysing volatility and pinpointing potential turning points in price movement.


