Fair Value Gap: What Is It, and How to Use It in Trading?

Price action and technical analysis are the keys to making the difference between steady profit and expensive errors in trading. A very effective tool that numerous traders employ is the fair value gap, or FVG, a method of identifying price imbalances that can uncover major profit-making possibilities.
In the following article, we will delve into the basics of FVGs, give trading strategies, and demonstrate how market strategy can be improved using such a theory.
Key Takeaways
- Fair value gaps are areas of price imbalance caused by rapid market movements.
- FVGs can form during volatile market conditions, institutional trading activity, or low liquidity periods.
- Effective risk management, including stop-loss placement and proper position sizing, is essential to trading FVGs successfully.
- While powerful, FVGs have limitations, such as vulnerability to smart money manipulation and false signals.
What is a Fair Value Gap?
The fair value gap is a market price imbalance that arises based on uncertain market fluctuations. It is when the market has left behind untraded prices because of aggressive buying or selling pressure. Price action “skips” these levels and, therefore, creates gaps that can also be used to forecast retracements or reversals by the trader.
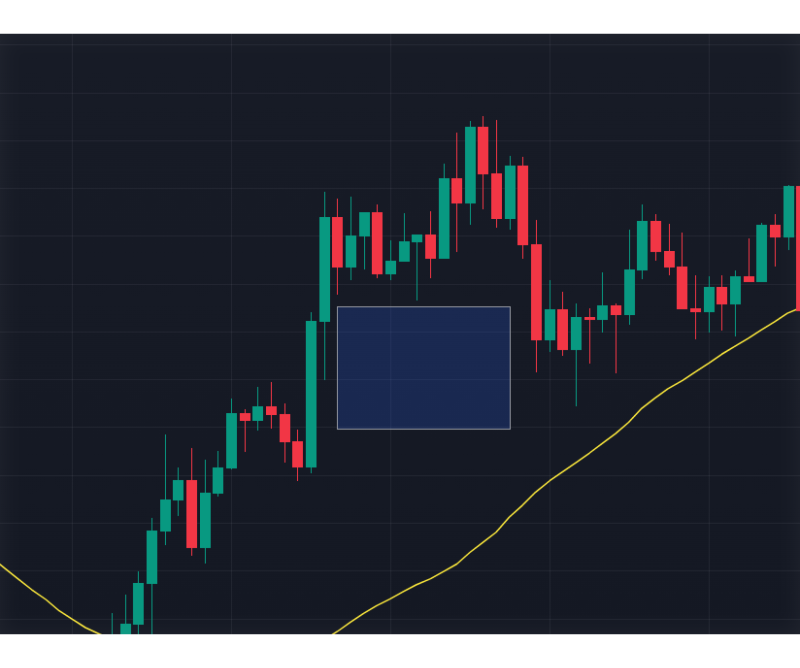
If a fair value gap appears, it is a sign of market inefficiency created by unequal demand and supply. The market tends to “fill” the gaps over time, going back to levels within the gap before continuing its larger trend.
For instance, if a candlestick’s low does not overlap with the top of the previous candlestick, there is a gap that can be filled by subsequent price action. These are frequently entry or exit points for the trader.
Types of FVG
Fair value gaps can be categorised based on market direction:
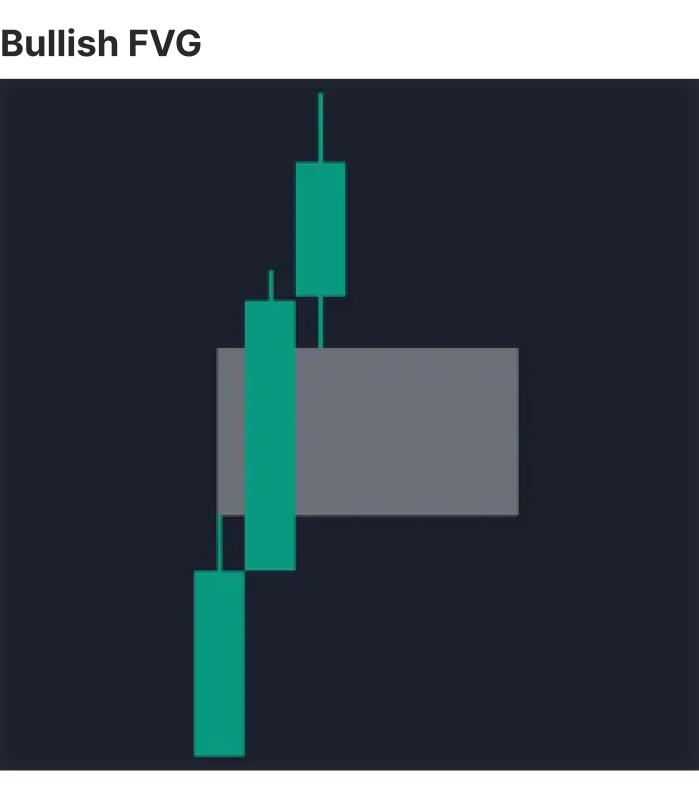
Bullish Fair Value Gap
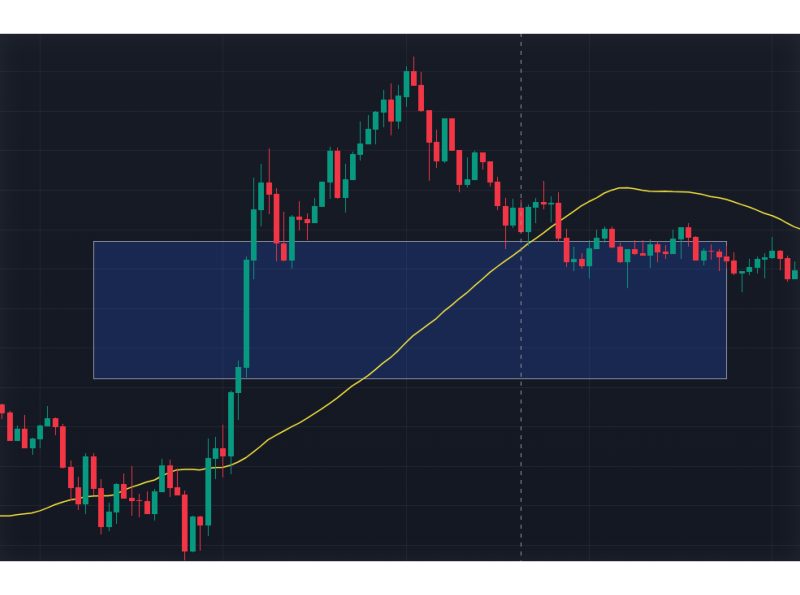
A bullish fair value gap occurs when upward price momentum skips certain levels, leaving a gap that the price may later retrace before continuing its upward trend. For instance, during a strong rally, the price might surge, leaving a space between the previous candle’s high and the next candle’s low.
Inverse (Bearish) Fair Value Gap
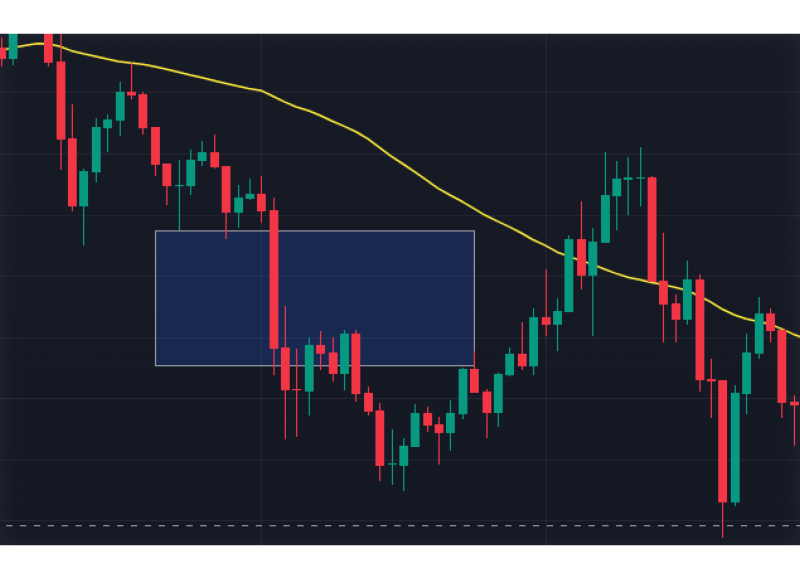
An inverse fair value gap, or bearish FVG, forms during strong downward movements. In this scenario, the price skips levels on its way down, creating gaps that the market may later fill as part of a corrective move before resuming its downward trend.
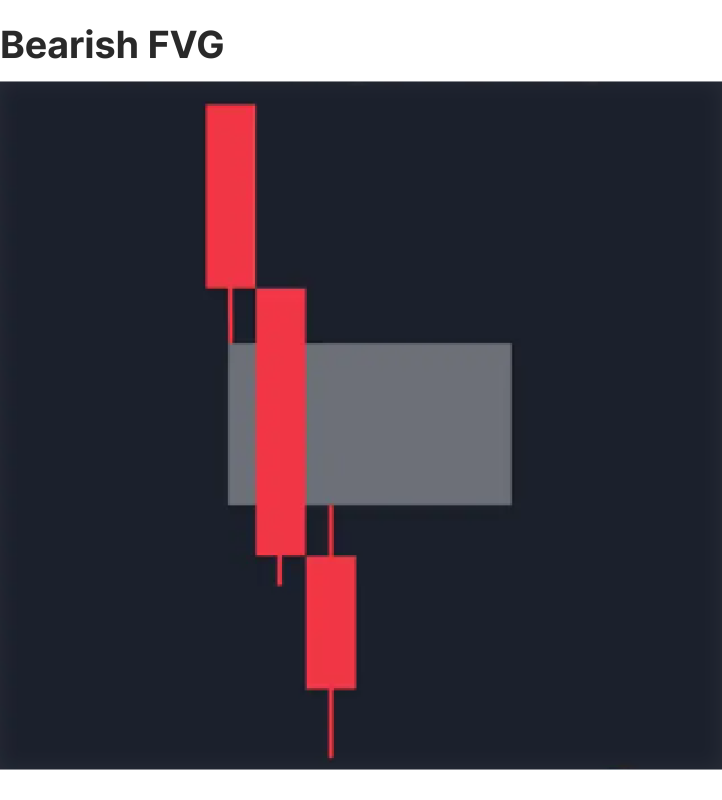
Both types of FVGs are rooted in the market’s natural tendency to seek balance. When unfilled orders accumulate, the price often retraces to these levels to execute the remaining trades, creating opportunities for traders to capitalise on these movements.
Fair Value Gap Example: Ethereum (ETH/USDT)
There is a visible fair value gap in the recent action in the Ethereum (ETH/USDT) 1-hour chart.
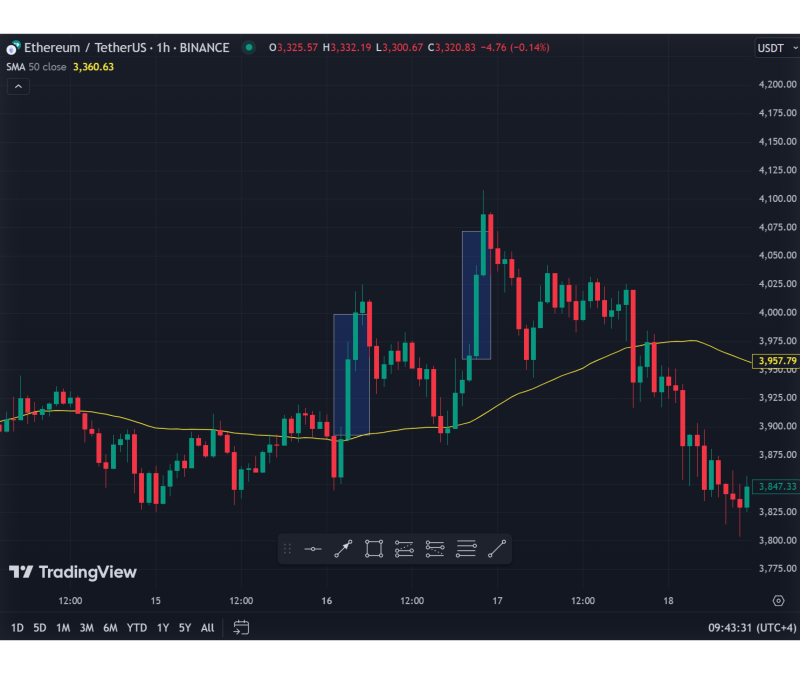
At a time of volatile conditions, Ethereum made a sharp move upwards, then retraced into a zone that had never been traded. It illustrated the principle of price imbalances and how they are used in trading strategies.
FVG was created after a very bullish advance on December 16, 2024. The ETH price jumped from around $3,800 to $4,000, leaving a range between $3,860 to $3,950 with a gap. It is a zone of imbalance brought on by a surge in buying, where the price action leapt over certain levels because demand was so high.
Have a Question About Your Brokerage Setup?
Our team is here to guide you — whether you're starting out or expanding.
In the following sessions, Ethereum’s price began to retrace from its highs around $4,100, heading back toward the FVG zone. On testing the gap, the price entered the imbalance area, briefly consolidating before resuming its upward trend.
What Causes a Fair Value Gap?
Fair value gaps are the result of rapid price movements that create imbalances in the market. These gaps can be caused by news, big trades, or even low activity in the market. Let’s look at the main reasons why FVGs happen.
Sudden Market Volatility
Prices can swing rapidly when markets are highly active, which creates gaps in the process. This often results when there are significant news events, such as announcements of economic results or political developments, or after a weekend when markets open.
For instance, if a firm announces significantly greater profits than anticipated, its stock value could surge rapidly and create an FVG.
Large Trades by Big Players
Big institutions, like banks and hedge funds, often trade huge amounts of money. When they buy or sell a lot at once, prices can skip levels because there aren’t enough orders to balance the move. These big players can also create gaps on purpose by pushing prices to trigger stop-loss orders from smaller traders.
Breakouts from Consolidation
Once the price has been trading within a narrow range and then breaks, an FVG can develop. The reason is that numerous market players enter the market concurrently, and the price is rapidly increasing. For instance, if a stock trades between $50 and $55 and breaks through $55, the value could easily surge to $60 and leave a gap.
Low Liquidity
When there are fewer traders in the market, prices can move unpredictably. This is common during holidays, weekends, or late-night trading hours. Fewer buy and sell orders are available, so prices skip over certain levels, creating FVGs.
Algorithmic Trading
Many trades today are made by computers using algorithms. These programs react to market changes in milliseconds, much faster than humans can. This speed can cause prices to move very quickly, leaving gaps as the market adjusts to the algorithms’ activity.
How to Identify a Fair Value Gap
Spotting FVGs requires attention to price charts and a clear understanding of candlestick structures. Here’s how you can identify them:
- Observe Candlestick Patterns: Look for areas where a candlestick’s wick or body does not overlap with the adjacent candlestick’s wick or body.
- Choose the Right Timeframe: FVGs appear across timeframes, but their significance varies. Larger gaps on daily or weekly charts often carry more weight than smaller gaps on intraday charts.
- Use Technical Tools: Indicators such as the Fair Value Gap Indicator automate the identification of gaps, saving time and reducing errors. These tools highlight gaps directly on your chart, making it easier to incorporate them into your analysis.
How to Trade Fair Value Gaps
Fair value gaps can help traders find good market opportunities. Below, we’ll explore strategies for trading FVGs, including how to enter and exit positions, enhance setups with other indicators, and manage risk effectively.
Entry and Exit Strategies
Fair value gap trading is based on waiting for the time the price comes back to the FVG, which usually acts like a support zone (in case of bullish gaps) or a zone of resistance (in case of a bearish gap).
For instance, in a bullish FVG, the price trends upwards swiftly, leaving a gap that it later covers before continuing its uptrend. A trader can place a buy order within the gap, expecting the price to bounce back up. Conversely, in a bearish FVG, the price retraces into the gap after a sharp drop, providing an opportunity to sell before the downtrend resumes.
FVG on a chart
You can play the exits by targeting the midpoint of the gap or the far side based on how far you anticipate the price to move. A trailing stop, which follows the increasing price, may also be used to bank profits and allow the trade to increase.
Combining FVGs with Indicators
Though FVGs are robust individual signals, they can be reinforced by using them along with other chart analysis tools. By doing so, traders gain multiple levels of affirmation and minimise the possibility of false signals.
- Moving Averages: Moving averages like the 50-period or 200-period SMA are used to identify the trend. For example, if a bullish FVG is generated above a 50-period SMA that is sloping upwards, there are excellent chances of a profitable trade.
- Relative Strength Index (RSI): RSI is ideal for identifying overbought or oversold levels in tandem with FVGs. A bullish FVG in an oversold market (an RSI of below 30) provides a high-probability buying signal, whereas a bearish FVG in an overbought market with an RSI of above 70 makes the case for selling.
- Fibonacci Retracements: FVGs frequently coincide with Fibonacci levels, like the 61.8% retracement, serving to add another level of credibility. It will become a stronger entry zone if a bull FVG coincides with a Fibonacci level in a trend.
Managing Risk When Trading FVGs
Even the most promising FVG setups can fail, which is why risk management is paramount. A disciplined approach ensures that losses are kept in check and profitable trades outweigh them over the long term.
- Stop Loss Placement: A well-placed stop loss is essential to protect against unexpected price movements. For bullish FVGs, the stop loss should typically be set just below the lower boundary of the gap. For bearish FVGs, it should be placed above the upper boundary.
- Position Sizing: The size of your trade should reflect your overall account size and risk tolerance. Many traders follow the 1-2% rule, risking no more than 1-2% of their total account balance on any single trade.
- Risk-Reward Ratio: Maintain a favourable risk-reward ratio, typically 1:2 or higher. This means that the potential reward for every $1 risked should be at least $2. For example, if your stop loss is $50 away, your target should be at least $100 to justify the trade.
Advantages of Fair Value Gap Trading
FVGs are widely regarded as powerful tools for both novice and experienced traders. Here’s why:
- Accurate Identification of Price Retracement and Reversal Points: FVGs identify explicitly demarcated zones of interest on a chart, enabling the trader to identify where the price is most likely to retrace or perform a reversal. The accuracy of FVGs can make entry and exit timing superior to that of broad indicators like trendlines or moving averages.
- Easy to Integrate with Other Strategies: FVGs are easily used in conjunction with other tools like Fibonacci retracements, RSI, and moving averages. Therefore, they form a versatile tool in a trader’s toolkit, making predictions even more accurate.
- Applicability to Various Time Horizons: FVGs are displayed on all time horizons, ranging from intraday charts used by scalp traders to charting on a weekly basis by longer-term traders.
- Better Risk-Reward Ratios: Traders tend to enter the trade at better prices by targeting retracements into FVG areas, minimising risk but maximising the potential reward. For instance, a trader entering a bullish FVG at a decreased price may place a tighter stop-loss and target a greater profit.

Disadvantages and Challenges of Fair Value Gap Trading
While FVGs are beneficial, there are several challenges traders must be aware of to avoid costly mistakes:
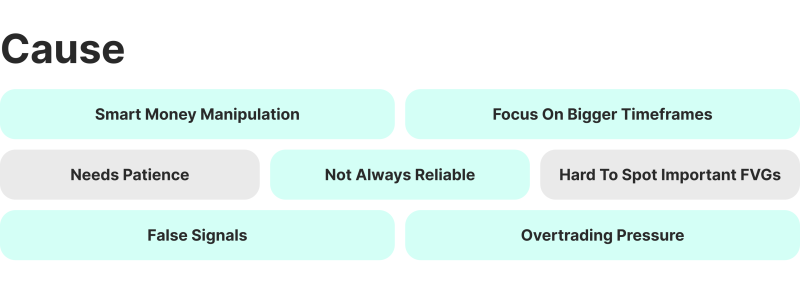
Vulnerability to “Smart Money” Manipulation
Fair Value Gaps are often exploited by smart money—large institutions, hedge funds, or professional traders—who have the resources and expertise to manipulate retail traders.
These market participants know that most amateur retailers make use of FVGs to pinpoint areas of potential retracement levels, and they prefer to take advantage of that by triggering false movements, pushing amateur retailers out of the market before the real movement materialises.
Also, intelligent money tends to trade on longer time horizons (e.g., daily or weekly charts). The variation in focus could lead to individual investors taking on trades on gaps that have no meaning larger than the market context.
Discover the Tools That Power 500+ Brokerages
Explore our complete ecosystem — from liquidity to CRM to trading infrastructure.
Requires Patience and Timing
FVG trading often involves waiting for price retracements to fill the gap, which can take time and test a trader’s patience. Impulsive traders may enter too early, anticipating a retracement, only to see the price continue moving against them. Similarly, waiting too long can cause traders to miss out on the ideal entry point altogether.
Not Reliable in All Market Conditions
FVGs are most effective in trending or volatile markets, where imbalances are more likely to be filled. However, price action may ignore FVG zones entirely when consolidating or in range-bound markets, making this strategy less reliable. For instance:
- In a strong uptrend, bearish FVGs may not fill because the buying pressure is too overwhelming.
- During low-volatility periods, the price may hover near an FVG without fully retracing or bouncing.
Difficulty Identifying Significant FVGs
Not all FVGs are equally important. Beginners often struggle to differentiate between meaningful gaps and minor imbalances that are unlikely to impact price. This can lead to overtrading or focusing on gaps irrelevant to the broader market context.
Prone to False Signals
Price retracing into an FVG doesn’t always guarantee a bounce or reversal. Traders can experience false signals where:
- Price enters the gap, giving the impression it will fill or reverse, but instead continues in the opposite direction.
- The gap gets partially filled but fails to generate a meaningful move, leading to premature exits or stop-outs.
False signals are particularly common in highly volatile markets or during times of market indecision.
Psychological Pressure and Overtrading
FVGs frequently appear on smaller timeframes, tempting traders to overtrade by chasing every setup they see. This can lead to exhaustion, higher transaction fees, and a lack of focus on quality setups. Furthermore, the frequent stop-outs that can occur with poorly placed FVG trades may frustrate traders, leading to emotional decisions and compounding losses.

Conclusion
Fair value gap trading can also be an adaptable strategy that improves your trading accuracy. Be sure to follow a solid plan in trading FVGs, include risk management in it, and pay attention to overall market conditions. Begin practising trading on demo accounts to hone your craft before trading with actual capital.
FAQ
How do you identify the FVG?
Fair value gaps are identified by looking for gaps in price action on a chart where consecutive candlesticks fail to overlap. These gaps are typically found between the wicks or bodies of candles after a sharp price movement.
What is the best indicator for fair value gaps?
The best indicator for FVGs depends on your trading platform, but tools like FVG indicators or custom scripts in platforms like TradingView can automatically highlight gaps. Otherwise, manually observing price charts is a good way to spot them.
Are fair value gaps reliable?
FVGs can be reliable when used in trending or volatile markets, but they are less effective in consolidating or quieting markets. Combining them with other tools like RSI, moving averages, or Fibonacci levels improves their reliability.
What invalidates an FVG?
An FVG is considered invalid if the price fully fills the gap and fails to reverse or bounce as expected. Additionally, a strong trend in the opposite direction or a lack of supporting confirmations (like volume or trend alignment) can make the FVG unreliable.


