10 Best TradingView Indicators For Wise Trading Decisions

Making correct decisions requires using the appropriate indicators. They can provide insightful information regarding price changes, market patterns, and possible trading opportunities. We will examine the best TradingView indicators that can improve your trading tactics.
Traders need many resources and tools to make bold predictions and generate income. Because of its extensive feature set and range of capabilities, TradingView is a reliable charting software traders utilise. As the website states, 60 million traders are using it, and this number is a statement itself.
Key Takeaways
- To support various trading methods, TradingView provides a range of charting tools, which improves decision-making.
- Common indicators that traders use to find trends, entry, and exit points include Moving Averages, RSI, and MACD.
- Predicting market volatility and possible price fluctuations is simplified using tools like Bollinger Bands and Volume Profile.
This article covers foundational trading indicators. For industry news and more educational materials from our team, join our official Telegram channel.
Charting Techniques in TradingView
Technical analysis is incomplete without charting, which gives traders a visual depiction of price movements that helps in decision-making. Many charting methods are available in TradingView, all intended to accommodate various trading inclinations and styles. Before discussing some indicators, let’s see a few charting techniques.
Candlestick Charts
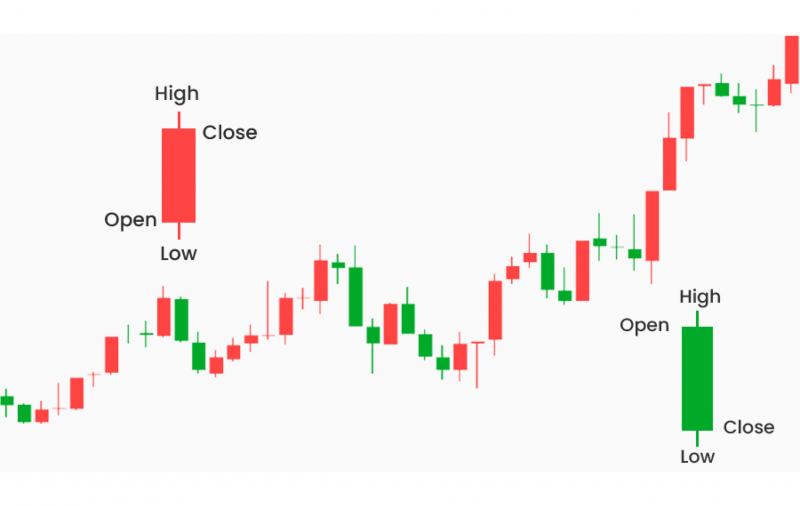
As their primary tool, technical analysts use candlestick charts, which show an asset’s open, high, low, and closing values over a given period. With the help of each candlestick’s indication of price movement, traders may spot patterns and anticipate future market trends.
Line Charts
Line charts offer a simplified price movement perspective by joining closing prices with a continuous line. This chart is perfect for seeing larger patterns without the complexity of detailed price data.
Bar Charts
Candlestick charts and bar charts are similar in that they display the closing price and the range between the high and low values using vertical bars. This graphic makes it easy to see how prices change over time.
Kagi Charts
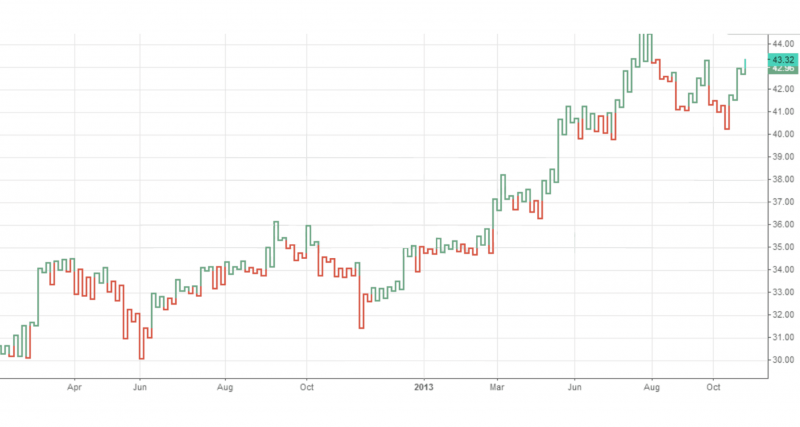
Kagi charts ignore time in favour of price movement. This kind of chart is beneficial in determining levels of support and resistance as well as changes in the market sentiment.
The Kagi Chart’s current up line or down line will remain in place as long as prices continue on their current track. Nonetheless, a horizontal line indicates a change in price direction when it shifts by a predetermined amount as the trader decides. A fresh line is formed in the other direction, terminating at the most recent closing price.
Five different line types can be drawn in a Kagi Chart:
- Up Lines, also called Yang Lines, emerge during an upward trend.
- Yin or down lines are generated when there is a downward tendency.
- Projected Up Lines indicate a potential upward trend based on the present price in an intraday context and are drawn before the closing price is confirmed.
- Projected Down Lines are based on the current price before the closing price is decided. Like Projected Lines, these lines suggest a possible downward trend during intraday trading.
- When the direction of a line changes, Horizontal Lines are drawn. It is called a Shoulder when an Up Line changes to a Down Line. On the other hand, a Waist is the Horizontal Line resulting from a Down Line to an Up Line.
Renko Charts
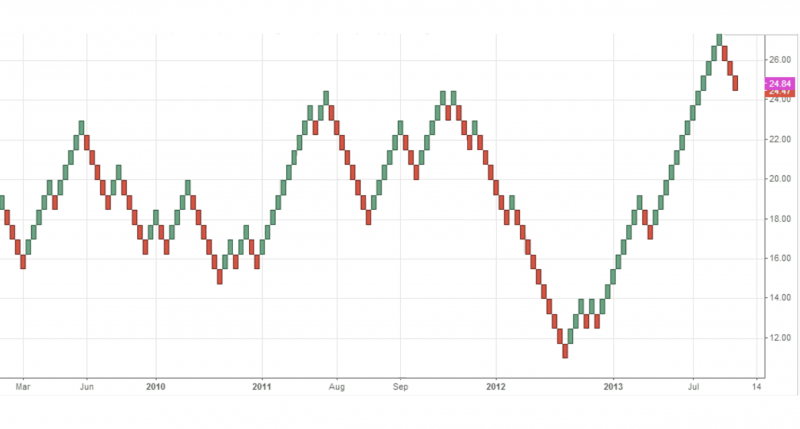
Renko charts just show price changes, also ignoring volume and time. By removing small price swings, they assist traders in seeing market patterns and possible reversals. The word “Renko” is derived from the Japanese word “renga,” which means “bricks,” and accurately characterises the construction of these charts. Bricks comprise each chart, and their construction is predicated on particular price swings.
The procedure for creating Renko bars is simple. When the price rises above or below the previous brick by a more significant amount than the user-specified “brick size,” a new brick is added to the chart.
However, new bricks are only added when the price movement equals or surpasses the “brick size.” The appearance of a new brick will only occur when the price closes at or above $56 or at or below $50.
For example, if the brick size is set to two points and the last brick reflects values from $52 to $54. The fresh brick would indicate a close at $56, even if the price ends at $57.
For brick placement, there are two main guidelines:
- Bricks need to be placed with their corners touching at all times.
- In a particular vertical column, only one brick can be present.
TradingView’s Renko charts produce four different kinds of bricks:
- Up Bricks are created on top of the preceding brick.
- Beneath the prior brick, there are Down Bricks.
- Projection Up Bricks indicate the possibility of an upward advance based on the present cost.
- Projection Down Bricks are based on present price patterns before determining the closing price. Like projection-up bricks, these bricks suggest a possible downward movement during intraday trading.
Line Break Charts
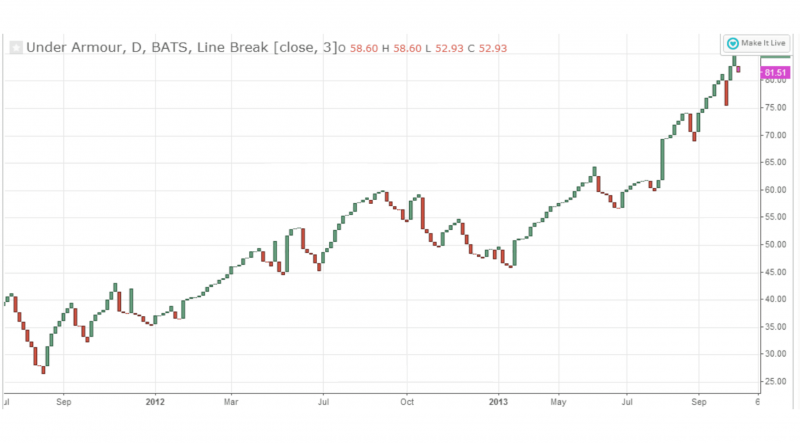
These charts illustrate possible trend reversals based on price movements rather than time intervals. They are beneficial for traders trying to measure market volatility and spot changes.
Like Kagi and Renko charts, Line Break charts are a type of Japanese charting where the focus is only on price changes, and time intervals are ignored. A sequence of lines makes up these charts. Upward lines denote rising prices, and downward lines denote dropping prices. The user-defined “Number of Line” parameter is a crucial component of line break charts.
For the chart to function, the closing prices of the prior line and the current lines’ closing prices are compared. One popular configuration is “3 Line Break,” which compares the current period’s closing price to the previous two’s closing price.
An upward line is drawn if the current price is higher and a downward line if it is lower. Nevertheless, no new line is added to the chart if the closing price of the current session matches that of the previous one or if the change isn’t substantial enough to indicate a reversal.
The best indicators require a professional trading environment. While this article explores powerful tools available on TradingView, remember that the quality of your execution and the strength of your trading ecosystem are equally crucial. We at B2BROKER provide cutting-edge solutions for serious brokers and traders.
Explore B2BROKER’s Set of Solutions
Breaking Down 10 Best TradingView Indicators
Finding the most accurate indicator on TradingView is crucial for the analysis of market movements and decision-making. They support the interpretation of market data, assessment of trends, and the identification of possible entry and exit locations. So, let’s begin.
1. Moving Averages
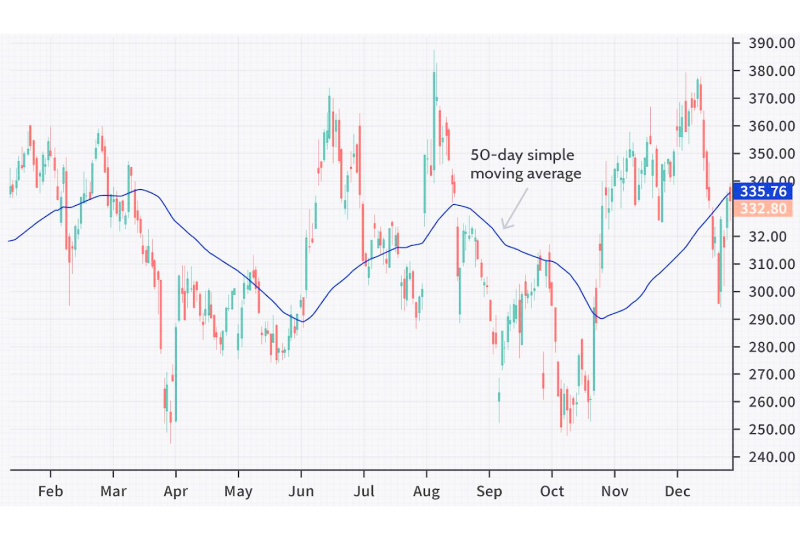
The fundamental instruments called moving averages are used to smooth out price data over predetermined periods to spot trends. They are primarily of two types:
Simple Moving Average (SMA) → The SMA determines the average price over a specified period. The average is continuously updated when new data becomes available. It offers signs for possible market entry or exit and assists in determining trend direction and levels of support and resistance.
Exponential Moving Average (EMA) → The EMA is more sensitive to recent changes in the market since it places greater weight on current pricing. It is calculated with a multiplier that modifies the weight assigned to more recent data points based on the chosen time. Whether identifying shifts in a trend or deciding whether to trade, the EMA is helpful.
Have a Question About Your Brokerage Setup?
Our team is here to guide you — whether you're starting out or expanding.
By mitigating price swings, both varieties of moving averages assist traders in identifying possible reversal points and trend direction.
Assume you are monitoring the price of one coin. You choose to employ a 5-day SMA to even out the price swings. On day 1, the price was $20,000. On day 2, it was $22,000, day 3 – $24,000, day 4- $25,000, and day 5 – $23,000.
The prices for the previous five days are added together and divided by five to determine the SMA: $22,800 is the SMA, or ($20,000 + $22,000 + $24,000 + $25,000 + $23,000) / 5.
This indicates that the average price of the coin over the previous five days was $22,800. The calculation can be carried out daily, yielding a new SMA value each time fresh price data becomes available.
A 5-day EMA would be a more complicated computation that would give current values more weight. For instance, the EMA would respond to a new price more forcefully than the SMA would if the price on Day 6 was $26,000.
2. Volume-Weighted Average Price (VWAP)
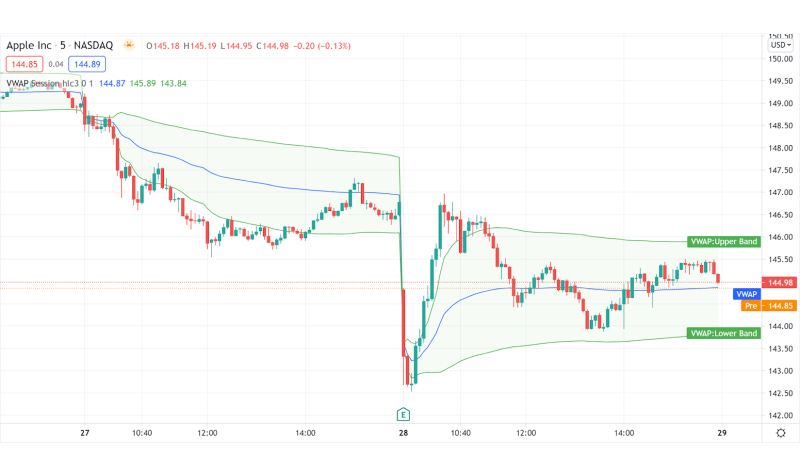
A method called the Volume-Weighted Average Price (VWAP) determines an asset’s average price over a trading day by weighting it according to trading volume. The VWAP is especially helpful for intraday trading since it offers a benchmark for comparing the current price to the day’s average price.
VWAP helps identify the current market trend and the strength of the purchasing or selling pressure. Prices below the VWAP would suggest selling pressure, while prices above it might suggest buying pressure.
Indicating whether the current price is favourable compared to the average price weighted by volume assists traders in making better decisions. This is important because it allows traders to execute trades at advantageous levels.
Assume that you are trading a coin. Its volume and price change during the day. The VWAP indicator determines the average price weighted by trading activity.
Assume that this coin’s VWAP at midday is $10. Considering the volume of each trade, this indicates that the average price of every coin traded before noon was approximately $10.
The coin trades above the VWAP if its current price is $12. Given that the current price exceeds the volume-weighted average price, this could indicate purchasing pressure. On the other hand, if it were $8, it would be less than the VWAP, suggesting that there would be selling pressure.
Accurate volume indicators require a deep, reliable data feed. Learn about our Tier-1 Prime of Prime Liquidity to ensure your market data is top-notch.
3. Relative Strength Index (RSI)
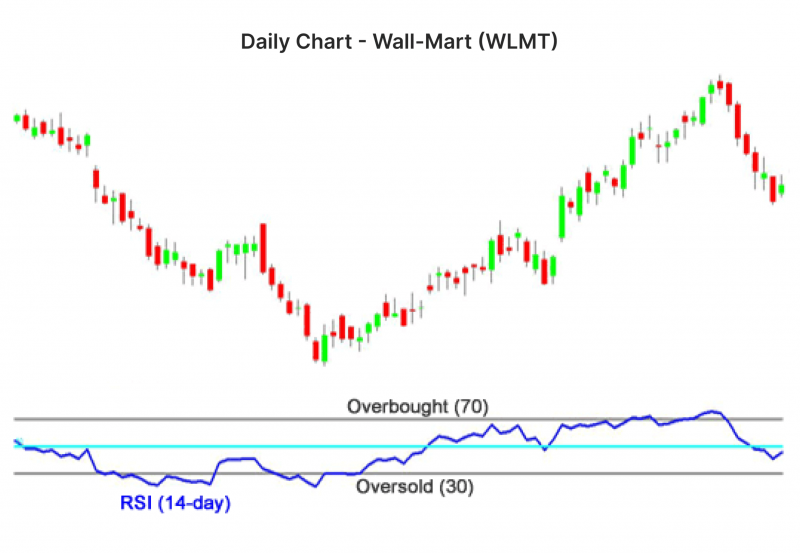
A momentum oscillator called the RSI measures how quickly and how much prices change to determine if a market is overbought or oversold. An RSI line graph with a range of 0 to 100 is displayed.
An asset’s RSI tells us if it has been overbought (usually an RSI over 70) or oversold (an RSI below 30). Identifying possible entry and exit positions may help signal future trend reversals or corrections.
The RSI improves traders’ ability to make timely trading decisions by identifying possible trend reversals and overbought or oversold positions.
Assume you have been trading the coin for a few days, and its price has gradually increased. At this moment, its RSI is 80. This suggests that the coin is in the area of overbuying.
An RSI score of 80 indicates a substantial likelihood of a price correction or pullback because the price has increased quickly. Although it does not guarantee a price decline, this does suggest caution. Before deciding to buy more, a trader may consider taking profits or reducing their position in anticipation of a possible price decline.
In contrast, an oversold situation would be indicated if the coin’s RSI was 25. This can indicate that the price is an excellent time to buy because it may be discounted. The RSI must be used in combination with other technical indicators to validate possible trading signals.
4. Moving Average Convergence Divergence (MACD)
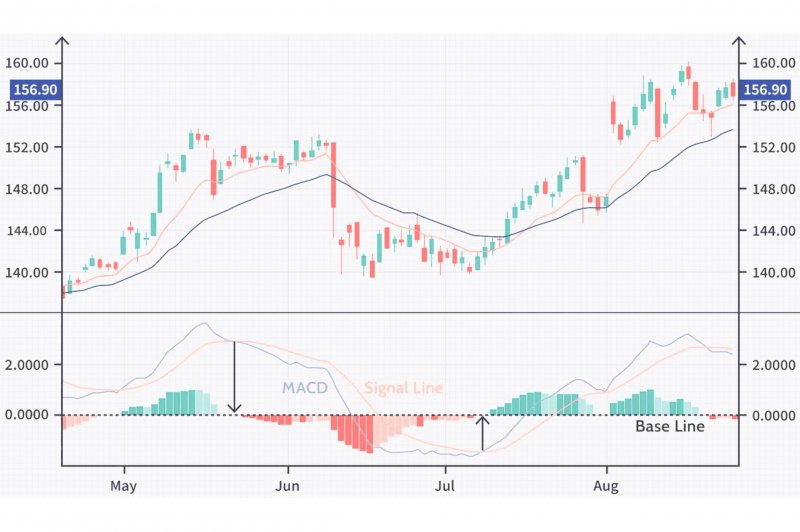
EMAs are used by the trend-following momentum indicator known as the MACD to measure market momentum. The MACD line is generated by measuring the difference between the 12-period EMA and the 26-period EMA. Known as the signal line, a nine-period EMA of the MACD line assists in creating buy or sell signals.
Traders use MACD to identify changes in trends and momentum. When the MACD line crosses above the signal line, buy signals happen, and when it crosses below, sell indications appear.
Through crossings between the MACD line and the signal line, MACD facilitates strategic trading decisions by providing actionable buy and sell signals.
Assume you are trading the coin, and you choose to utilise the MACD to assist in identifying possible opportunities for purchases and sales.
Right now, the signal line is above the MACD line. This could point to a bearish trend or a coin price decline. Nevertheless, the MACD line appears to be about to cross above the signal line and is beginning to flatten.
It might be considered a positive indication, suggesting a potential upward price movement if the MACD line crosses above the signal line. This might be an excellent time to think about purchasing the coin.
5. Bollinger Bands
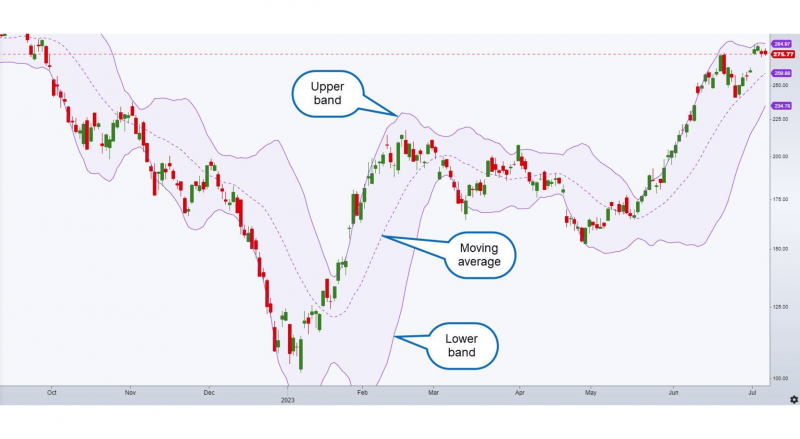
Bollinger Bands comprise two bands positioned two standard deviations above and below the central line, which is a 20-period SMA.
These bands indicate possible overbought or oversold situations and quantify price volatility. The price approaches the lower band, which could suggest oversold conditions, while the price approaches the upper band, which could indicate overbought conditions.
Bollinger Bands show shifts in market volatility and possible price extremes, which helps traders anticipate price breakouts or reversals.
The Bollinger Bands are getting more expansive, and the price of your chosen coin has been climbing quickly. This suggests that market volatility is rising. Coin’s price is approaching the upper Bollinger Band, indicating that there may be an overbought situation. This can indicate a possible reversal or correction in the price.
However, if the coin’s price was approaching the lower Bollinger Band and the bands were getting closer together, this may be a sign of an impending oversold situation. One could consider this to be a possible purchase opportunity.
6. Volume Profile
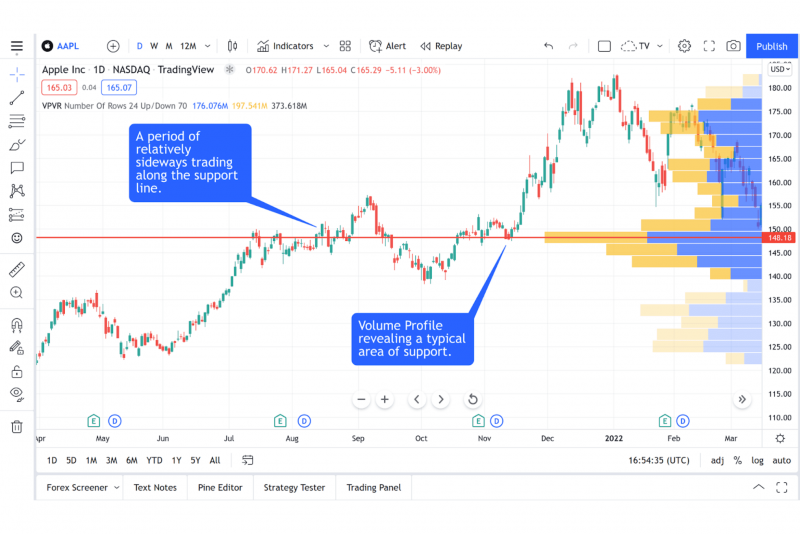
The Volume Profile indicator shows the amount of trading over a given period at different price points. Each horizontal bar displayed along the side of the price chart represents the volume traded at a specific price.
This indicator uses the concentration of trading volume to determine the necessary levels of support and resistance.
The Volume Profile helps traders understand market interest and identify possible turning points in price action by disclosing critical levels of market activity.
Assume that you are trading the coin and want to know where you had the most purchasing and selling activity during the day.
To see this data visually, utilise the Volume Profile indicator. The indicator around the $5 price level displays a large, wide bar. This suggests that a significant amount of the coin was exchanged at this price. Both buyers and sellers are interested in this price range.
Depending on the market’s direction, the coin’s price may run into resistance or support if it trends back toward the $5 mark. This is because many traders have purchased or sold at this price in the past, and their orders may impact the market dynamics today.
7. Ichimoku Cloud
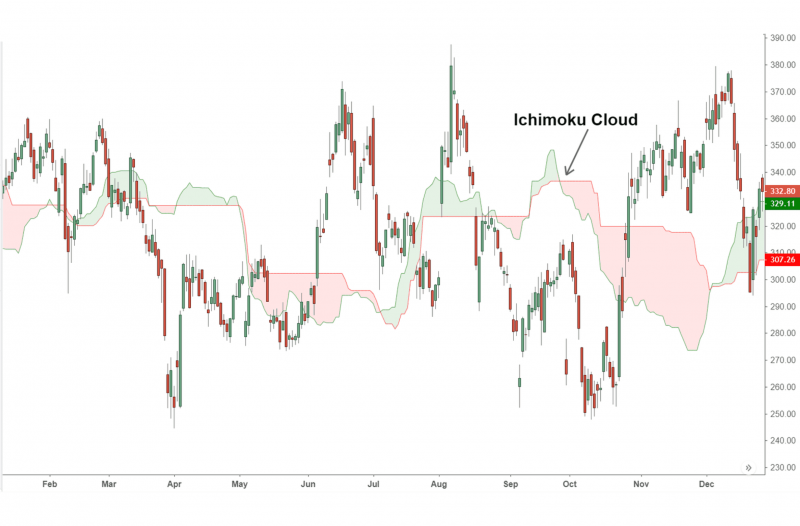
Five components comprise the indicator known as the Ichimoku Cloud: the Base Line, Conversion Line, Leading Span A, Leading Span B, and Lagging Span. These components form a “cloud” that predicts future support and resistance degrees.
The Ichimoku Cloud offers a comprehensive view of market trends, momentum, and significant support and resistance levels. It assists traders in evaluating the state of the market as a whole and forecasting future price fluctuations.
With its broad view of market dynamics, the Ichimoku Cloud enables traders to rapidly identify necessary support and resistance areas as well as the trend direction of the market. If you wish to understand the coin’s pricing trend and probable future changes, using the Ichimoku Cloud indication might be your option.
You may see a green cloud using the Ichimoku Cloud. This typically denotes a positive trend, implying that further price increases are probably in store. The positive indication is strengthened by the fact that the price is currently above the cloud.
In addition, the price is above the leading indicators, or Leading Span A and B, which suggests that an upward movement is possible. You can use this information to make more intelligent trading decisions by identifying potential support and resistance levels.
A solid trading system needs a solid foundation for managing accounts and funds. See how B2CORE can become the core of your brokerage operation.
Discover the Tools That Power 500+ Brokerages
Explore our complete ecosystem — from liquidity to CRM to trading infrastructure.
8. On-Balance Volume (OBV)
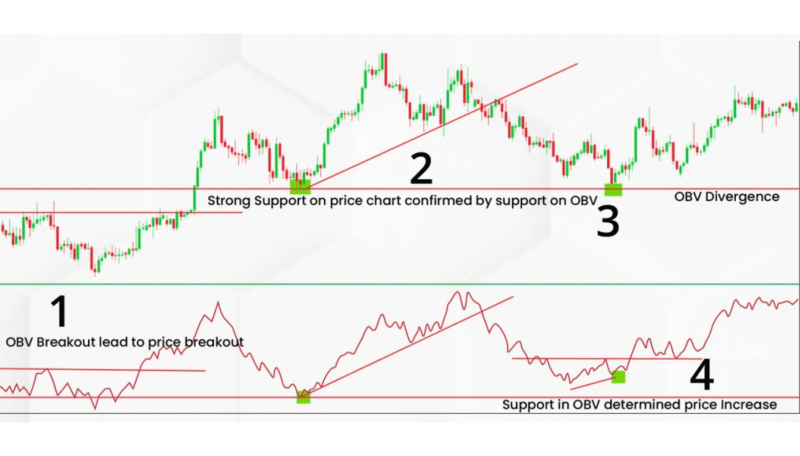
On-Balance Volume, the OBV, is a cumulative indication. It was created to monitor volume flow and forecast changes in stock prices.
OBV is used to validate price trends and spot probable reversals by analysing the correlation between volume flow and price movement. It is added on days when the volume is up, and on days when it is down, it is subtracted.
By examining if volume is entering or leaving a specific asset, OBV can indicate the strength or weakness of price movements. This is an essential tool for trading techniques since it can assist traders in projecting future price fluctuations.
If you want to know how to add indicators on TradingView, go to the “Indicators” menu, type “On-Balance Volume,” and choose it from the list to add the OBV indicator to TradingView. Go to the chart, hold your cursor over the indicator’s name at the top, and select the “x” icon. That’s how to remove indicators in TradingView.
9. Supertrend
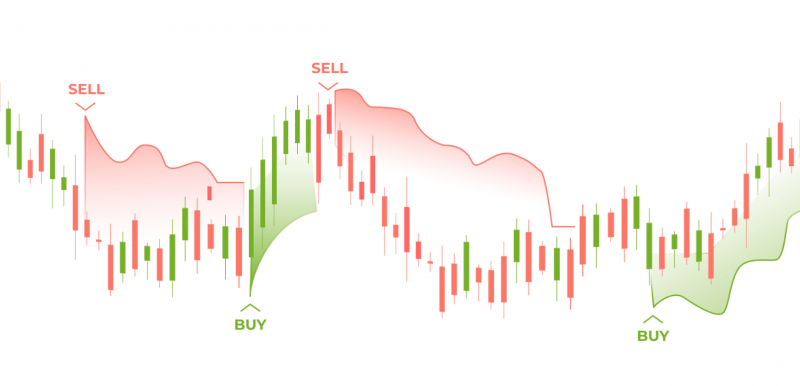
One trend-following tool that adapts to market volatility is the Supertrend indicator. It is represented as a line that can determine the dominant trend on the price chart.
Supertrend is mainly utilised to identify trade entry and exit points and the direction of the market trend. The market is said to be in an uptrend when the price is above the Supertrend line and a downtrend when it is below.
Staying on the right side of the trend is simplified by the Supertrend, which streamlines the process of spotting the market trend. Additionally, it can be used in conjunction with other indicators to improve trade tactics.
Want to offer these indicators on a professional-grade platform? Explore B2TRADER, our ultimate multi-asset trading terminal with advanced charting tools.
10. Pivot Points
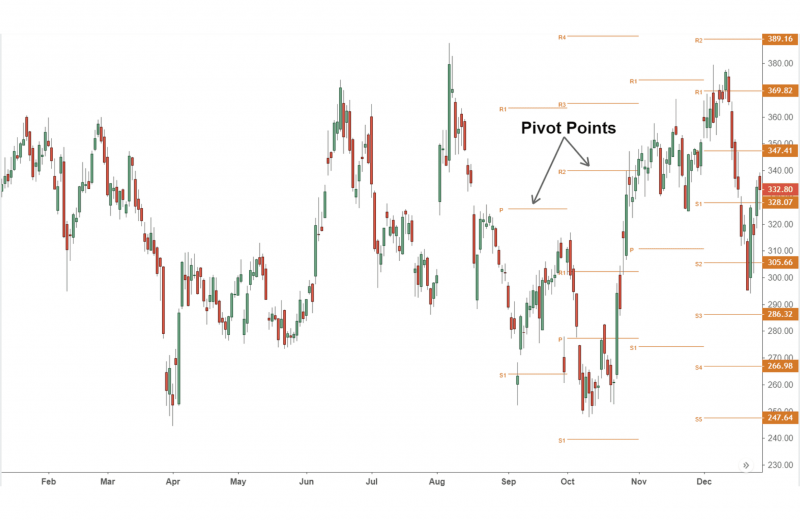
Pivot Points determine prices using historical trading data, including high, low, and close prices. These levels represent possible places of resistance and support where the price could turn around or surpass.
Traders use Pivot Points to spot market reversals and forecast future price movements. Because they offer precise and practicable price levels, these points are beneficial for determining stop-loss and take-profit levels.
By providing a simple method for identifying Pivot Points in the market, traders can more easily plan trades with straightforward entry, exit, and risk management procedures.
Final Notes
Choosing the best TradingView indicators is essential to match your unique trading approach and style. You should experiment with various indicators to determine which indications offer the most helpful information for your particular requirements. Combining different ones can improve analysis and provide a more comprehensive view that might help you make better decisions.
Stay Ahead of the Market with B2BROKER
Sometimes, the most advanced indicators are only as good as the platform they run on and the data they analyse. A professional trading ecosystem with deep liquidity and robust management tools is what truly separates successful traders and brokers from the rest.
Get daily market news, analysis, and exclusive insights directly from our team. Be the first to know about new corporate updates and industry trends.
FAQ
What are the best TradingView Indicators for identifying market trends?
Some of the top TradingView Indicators for identifying trends include Moving Averages (SMA/EMA), the Ichimoku Cloud, and Supertrend. These indicators help traders determine the direction of price movements and identify support and resistance levels effectively.
Which TradingView Indicators are best for intraday trading?
For intraday trading, Volume-Weighted Average Price (VWAP) and Moving Average Convergence Divergence (MACD) are excellent TradingView Indicators. They provide real-time insights into price trends, volume-weighted averages, and momentum shifts for short-term trades.
Which are the 10 best TradingView Indicators?
1. Moving Averages,
2. Volume-Weighted Average Price (VWAP),
3. Relative Strength Index (RSI),
4. Moving Average Convergence Divergence (MACD),
5. Bollinger Bands,
6. Volume Profile,
7. Ichimoku Cloud,
8. On-Balance Volume (OBV),
9. Supertrend and 10. Pivot Points.


