Fibonacci Retracement Levels: Comprehensive Guide
Today, trading in capital markets heavily relies on technical analysis. This method provides a comprehensive view of market sentiment and uncovers patterns in price movement, revealing shifts in absolute and relative indicators over time for each asset.
To identify short- and long-term trends in price movements, along with corrections and correlations with other price characteristics, weighted average deviations from Fibonacci levels are often applied. This indicator serves as a benchmark for anticipating possible scenarios in price trend development.
This article will tell you what Fibonacci retracement levels are and how they are used in trading. You will also learn how they differ in type and what recommendations can help you use them as effectively as possible.
Key Takeaways
- Fibonacci levels often align with market participants’ natural points of profit-taking and risk management, which is why price reactions at these levels can be significant.
- Fibonacci retracement works across different time frames (e.g., intraday, daily, weekly), making it versatile for short-term and long-term traders.
- Many traders combine Fibonacci retracement with other metrics like moving averages, RSI, or MACD to confirm potential reversals or continuation patterns.
What is Fibonacci Retracement?
Fibonacci retracement is a frequently employed technical assessment metric traders use to discern approaching areas of support and resistance in the price of an asset. It is based on the Fibonacci sequence, a mathematical formula that appears in many natural patterns.
The retracement levels (23.6%, 38.2%, 50%, 61.8%, and 78.6%) represent key points where a price correction or pullback could reverse and continue in the direction of the main trend.
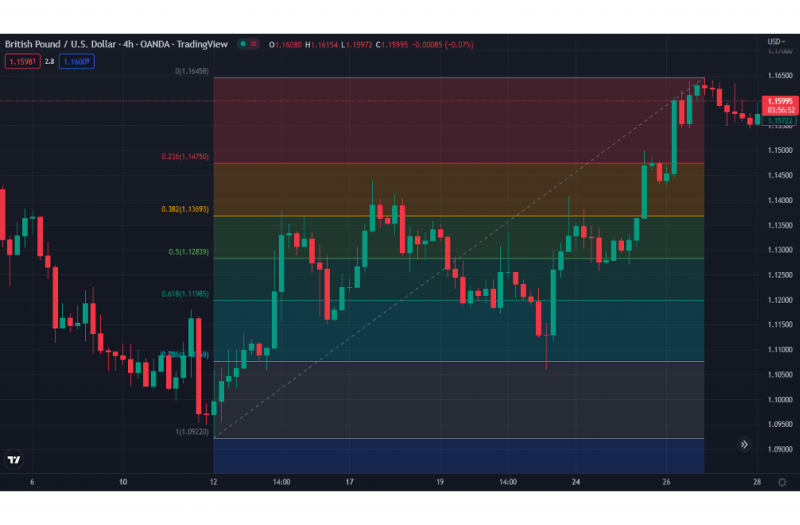
Traders use Fibonacci retracement by drawing it between significant swing highs and lows on a price chart. These retracement levels help traders predict possible price turn-around points where the market might change direction, making identifying entry and exit points for trades easier.
While Fibonacci retracement doesn’t always guarantee an exact reversal, it is a widely used tool with other indicators for more informed decision-making.
In addition to identifying potential reversal points, Fibonacci retracement can also be used to gauge the strength of a price trend. When a price retraces to a Fibonacci level and holds, it can indicate that the trend is strong and likely to continue. Conversely, if the price breaks through these levels, it may signal a weakening trend or a possible reversal.
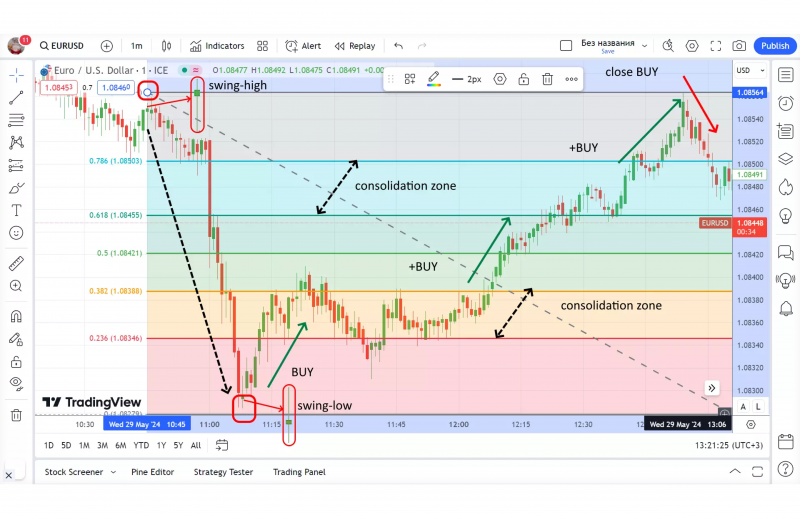
Traders often combine Fibonacci retracement with other tools, such as moving averages, trend lines, and candlestick patterns, to confirm signals and improve the accuracy of their trades. This flexibility makes Fibonacci retracement versatile in trending and ranging market conditions.
Extensive backtests of Fibonacci retracement across thousands of stocks have revealed that 38%, 50%, and 62% retracement levels were no more likely to occur than any other.
How Fibonacci Retracement Works in Trading?
Fibonacci retracement helps traders identify potential reversal points in the price of an asset by applying mathematical ratios derived from the Fibonacci sequence. For Fibonacci retracement, traders first select two key points on a price chart: a swing high (the peak) and a low (the bottom). The tool then automatically plots horizontal lines between these two points at the Fibonacci levels (23.6%, 38.2%, 50%, 61.8%, and 78.6%).
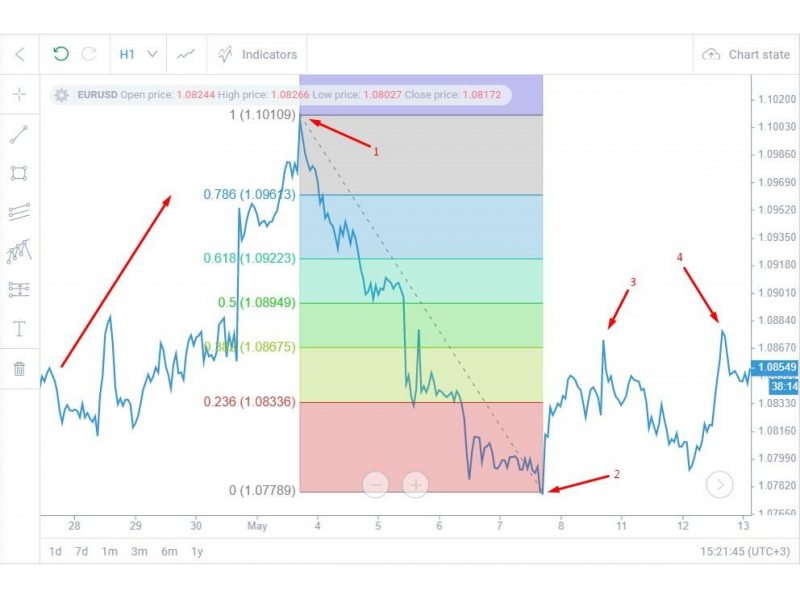
Example: If a stock rises from $50 (swing low) to $100 (swing high), the Fibonacci retracement tool will draw lines at $61.80, $73.60, and so on.
These levels represent areas where the price might “retrace” or pull back before resuming its upward trend. Similarly, if the market is in a downtrend, traders use the retracement tool to find potential resistance levels as the price recovers.
Traders watch how prices behave around these retracement levels to decide whether to enter or exit trades. If the price stalls or reverses near a Fibonacci level, it could indicate a continuation of the trend or a reversal, making these levels valuable for determining support and resistance zones.
Combining Fibonacci retracement with other technical indicators helps traders confirm potential market moves and improve the accuracy of their trading decisions.
Key Fibonacci Levels and Their Significance
The indicator Fibonacci retracement levels today enjoys great popularity due to its high accuracy in predicting the price behaviour of certain assets, especially in combination with other analytical and statistical tools.
At the same time, as it is clear from the name, this indicator has certain levels, each of which has a special interpretation of analysing the dynamics of changes in price indicators. Here they are:
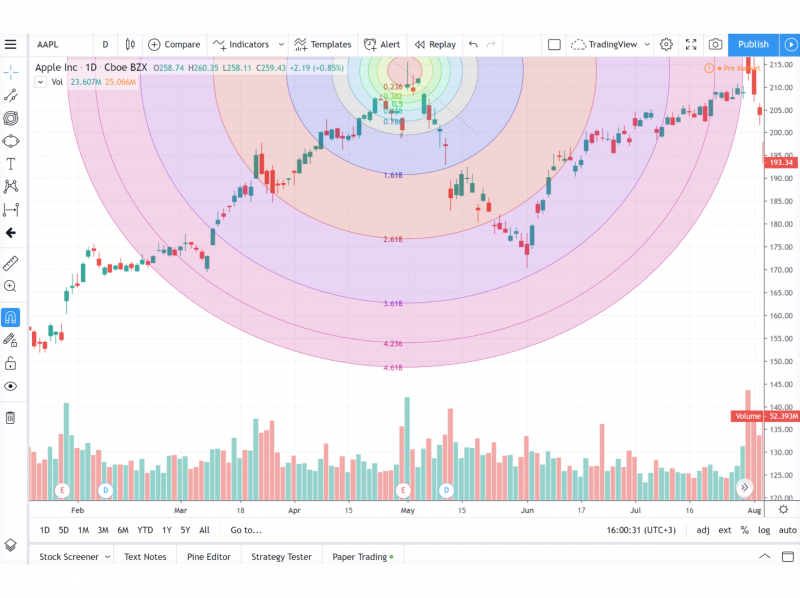
23.6% Retracement Level
The 23.6% retracement level is often the first level where traders expect the price to slightly correct before continuing toward the prevailing trend. This level represents a shallow pullback, usually during strong trends where buyers (in an uptrend) or sellers (in a downtrend) maintain control, but some profit-taking or minor reversals occur.
When the price only retraces 23.6%, it suggests that market participants are eager to continue the trend, showing strong momentum. In a fast-moving market, corrections are small, which indicates confidence that the trend will persist.
Traders typically use this level to spot minor pullbacks, often entering trades in the direction of the trend after the price retraces to this level.
38.2% Retracement Level
The 38.2% level represents a more notable correction, suggesting a more significant pullback from the recent price move. At this level, traders expect stronger reactions, as this level often represents a critical support or resistance point.
A bounce from the 38.2% retracement level indicates that the trend remains intact, with traders using this point to enter new positions or add to existing ones. If the price falls through this level, the correction could deepen further.
Traders look for confirmation patterns (like candlestick patterns or momentum indicators) when the price reaches this level to identify whether the trend will continue or reverse.
50% Retracement Level
Although not an official Fibonacci level, the 50% retracement level has significant psychological importance. It is considered a “halfway” point between the high and low of a price move. Many traders believe that a retracement to 50% signals equilibrium in the market before the price resumes its original trend.
Have a Question About Your Brokerage Setup?
Our team is here to guide you — whether you're starting out or expanding.
This level often serves as a battleground between buyers and sellers. If the price holds at the 50% level, it can indicate that the trend is still intact. However, failure to hold this level can suggest weakening momentum.
Traders frequently watch this level to enter trades with the trend or to confirm whether a deeper retracement or reversal might follow.
61.8% Retracement Level (The Golden Ratio)
The 61.8% level, often called the “Golden Ratio” or “Fibonacci retracement golden zone”, is among the most critical Fibonacci retracement extension levels in technical analysis.
It is derived from the Fibonacci sequence and represents a deeper retracement within a trending move. This level often marks a vital support or resistance area, where the price frequently bounces back toward the primary trend.
A retracement to 61.8% is typically seen as a strong corrective move but still within the boundaries of a normal correction. If the price holds here, it signals a high probability of the trend resuming. Traders consider this a major decision point, as failure to hold this level may lead to further retracement or even a reversal.
Traders often look for strong signals, such as volume spikes or price patterns, around the 61.8% level to confirm trend continuation. If the price rebounds from this level, it can offer attractive risk/reward trade setups.
78.6% Retracement Level
The 78.6% retracement level represents a deep pullback and is seen as the last significant Fibonacci level before a full retracement or potential reversal. This level often acts as a final point of support or resistance before the market either resumes its original trend or completely reverses.
If the price reaches this level but holds and bounces back, it signals a strong possibility of the original trend continuing. However, if the price breaks through this level, it often suggests that the market is more likely to reverse direction entirely.
Traders use this level to manage risk, as it provides a clear decision point for setting stop-loss orders. If the price reverses sharply at this level, it offers a good opportunity to enter a trade with a tight stop.
Combining Fibonacci Retracement with Other Technical Tools
Fibonacci retracement is a powerful tool for gauging prospective support and resistance gaps, but its true strength comes when combined with other technical forecasting tools. This combination allows traders to confirm the validity of Fibonacci levels, increase the accuracy of entry and exit points, and improve overall trading strategies.
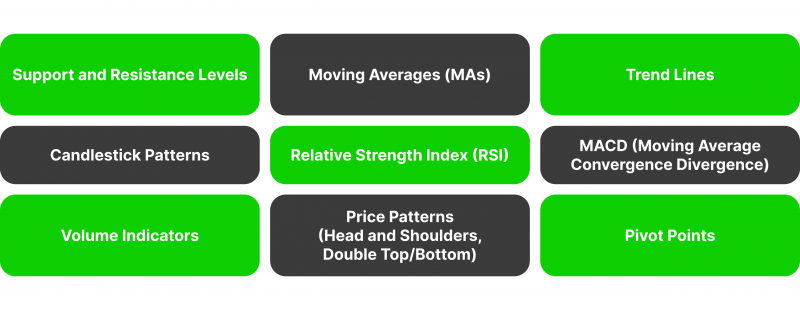
Here’s a detailed look at how Fibonacci retracement can be combined with various technical tools for more robust trading decisions:
Support and Resistance Levels
Traditional support and resistance levels are key price points where the market tends to reverse or consolidate. These levels are drawn based on historical price movements. If a Fibonacci retracement level aligns with a strong historical support or resistance frame, it adds more significance to that level. Traders view this as a confluence, where two important indicators signal the same potential reversal or continuation point.
Example: If the 61.8% Fibonacci retracement level coincides with a strong historical support zone, the likelihood of a price bounce from that area increases.
Traders use this confluence as confirmation to enter a trade or place stop-loss orders just beyond these levels, expecting a stronger reaction from the price.
Moving Averages (MAs)
Moving averages smooth out price data to identify trends and provide dynamic support or resistance ranges. It provides a stronger signal when Fibonacci levels align with key moving averages like the 50-day or 200-day MA.
Example: If the price retraces to the 38.2% Fibonacci level and also touches the 50-day moving average, this confluence suggests that the price is more likely to respect the Fibonacci retracement level and continue in the trend’s direction.
Traders often use the moving average crossover strategy combined with Fibonacci retracement to confirm trend strength or weakness. Bouncing off the Fibonacci level and a moving average provides a more reliable entry point.
Trend Lines
Trend lines are drawn on price charts to connect swing highs and swing lows, helping traders visualise the direction of a trend.
When a Fibonacci retracement level coincides with a well-established trend line, it strengthens the signal. If the price pulls back to a Fibonacci level and a rising trend line in an uptrend, it signals a potential buying opportunity.
Traders use trend lines in combination with Fibonacci to decide whether to enter or exit a trade. If the price respects the trend line and a Fibonacci level, it suggests that the trend is still intact, offering a favourable risk/reward trade.
Candlestick Patterns
Candlestick patterns, such as hammer, engulfing, or doji, provide visual cues about market sentiment and potential reversals. If a candlestick pattern forms at a key Fibonacci retracement level, it adds extra confirmation of a potential reversal.
Example: If a bullish engulfing pattern forms at the 61.8% Fibonacci level during a pullback, it suggests that buyers are regaining control, and the uptrend is likely to continue.
Traders use these patterns alongside Fibonacci levels to confirm entries or exits. If a price forms a reversal pattern at a Fibonacci level, they may enter a trade, placing their stop-loss orders just beyond the retracement level for safety.
Relative Strength Index (RSI)
RSI is a momentum oscillator that measures the speed and change of price movements to indicate overbought or oversold conditions. When the RSI shows an overbought or oversold condition at a Fibonacci retracement level, it signals a potential reversal.
Example: If the price retraces to the 38.2% level and the RSI is in the oversold zone, the market could reverse upwards, making it a good buying opportunity.
Traders use the RSI to identify whether a pullback to a Fibonacci level is likely to reverse or continue. When combined with Fibonacci, RSI confirms whether the price will likely respect or break through the retracement level.
MACD (Moving Average Convergence Divergence)
MACD is a trend-following momentum indicator that shows the relationship between two moving averages of prices. When the MACD crosses its signal line near a Fibonacci retracement level, it can confirm the likelihood of a price reversal.
Example: If the price retraces to the 50% Fibonacci level and the MACD line crosses above the signal line, it indicates a potential upward move.
Traders use MACD to confirm trends and reversals at Fibonacci levels. A MACD crossover that aligns with a Fibonacci retracement adds confidence that the price will continue in the direction of the trend.
Volume Indicators
Volume is the number of shares or contracts traded in a security, showing the strength behind price movements. When the price reacts at a Fibonacci retracement level with high trading volume, it confirms the significance of that level.
Example: A bounce from the 61.8% retracement level and a spike in volume indicate strong buying interest, suggesting the trend will continue.
Traders use volume to validate Fibonacci retracement levels. A price move at a Fibonacci level with low volume may indicate a false signal, while high volume suggests a stronger trend continuation or reversal likelihood.
Price Patterns (Head and Shoulders, Double Top/Bottom)
Price patterns like head and shoulders or double tops/bottoms signal potential trend reversals. It provides a more reliable signal when Fibonacci retracement levels align with classic price patterns.
Example: If a head and shoulders pattern forms near the 61.8% retracement level, it reinforces the likelihood of a trend reversal.
Traders use price patterns alongside the Fibonacci ratio to spot potential reversal points. If the pattern completes at a key Fibonacci level, it confirms the trade setup, making it easier to decide on entry and exit points.
Pivot Points
Pivot points are calculated levels that indicate potential turning points in the market and are commonly used in day trading. When a Fibonacci retracement level overlaps with a pivot point (such as the main pivot, support, or resistance levels), it strengthens the importance of that price level.
Example: If the 38.2% Fibonacci level aligns with the daily pivot point, it provides a stronger indication of potential price reversal or continuation.
Discover the Tools That Power 500+ Brokerages
Explore our complete ecosystem — from liquidity to CRM to trading infrastructure.
Traders often combine pivot points with Fibonacci to confirm short-term support and resistance levels, especially in intraday trading.
Practical Tips for Using Fibonacci Retracement in Trading
Fibonacci retracement can be a valuable tool for traders, but its effectiveness depends on how well it is applied and combined with other trading strategies. Here are some practical tips to improve your use of Fibonacci retracement in trading:
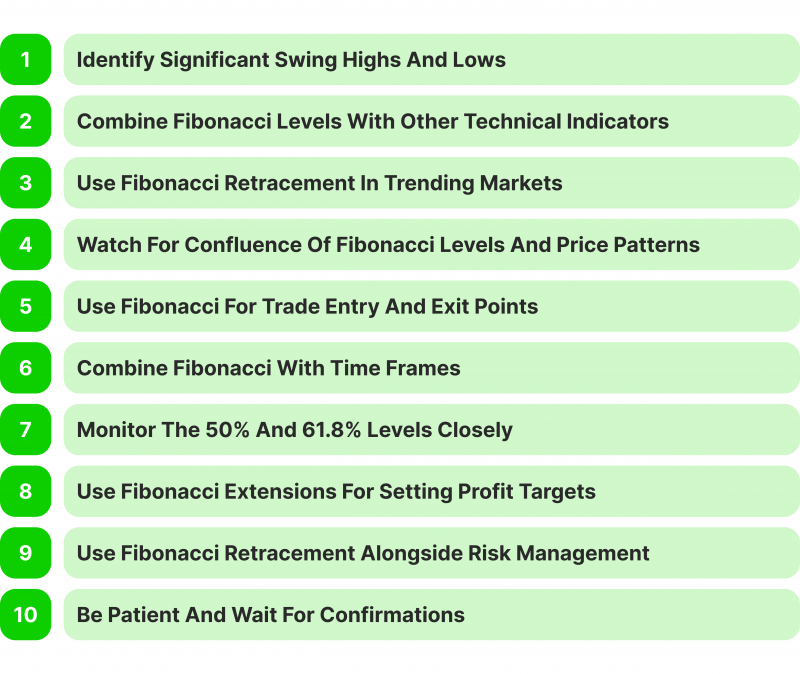
Identify Significant Swing Highs and Lows
Use Fibonacci retracement between significant swing highs and lows on the chart to evaluate possible support and resistance patterns. In an uptrend, draw the Fibonacci retracement from the most recent swing low to the swing high. Pull it from the swing high to the swing low in a downtrend.
Combine Fibonacci Levels with Other Technical Indicators
Don’t rely solely on Fibonacci retracement; combine it with other indicators like moving averages, trend lines, or oscillators (RSI, MACD) for confirmation. Look for confluence where Fibonacci levels align with moving averages or trend lines. This strengthens the likelihood of a support or resistance holding.
Use Fibonacci Retracement in Trending Markets
Fibonacci retracement is most effective in trending markets, where price pullbacks occur before resuming the trend. Using Fibonacci to identify potential buy zones at support levels in an uptrend. In a downtrend, look for resistance zones to enter short positions.
Watch for Confluence of Fibonacci Levels and Price Patterns
Look for price patterns like double tops/bottoms, head and shoulders, or candlestick formations (like hammers or engulfing patterns) at key Fibonacci levels. If a reversal pattern forms at a Fibonacci level (e.g., 61.8%), it’s a strong signal that the market might reverse direction.
Use Fibonacci for Trade Entry and Exit Points
Use Fibonacci retracement levels to determine the best trade entry and exit points. Enter trades near key Fibonacci support (in an uptrend) or resistance (in a downtrend) levels and place stop-loss orders slightly beyond these levels to limit risk. Exit trades when the price reaches the next Fibonacci level in the direction of the trend.
Combine Fibonacci with Time Frames
Apply Fibonacci retracement on multiple time frames for a better perspective. Use more extended time frames (e.g., daily or weekly) to identify major Fibonacci levels and shorter time frames (e.g., hourly or 15-minute) for more detailed entries.
Monitor the 50% and 61.8% Levels
Pay special attention to the 50% and 61.8% Fibonacci retracement levels, as many traders commonly watch them. Use these levels as potential areas for a reversal or trend continuation. A strong price reaction here could signal an opportunity to enter or exit a trade.
Use Fibonacci Extensions for Setting Profit Targets
After a pullback, use Fibonacci extension levels to predict where the price may go next. Draw Fibonacci extensions from the retracement to set potential profit targets at the 100%, 127.2%, or 161.8% extension levels.
Use Fibonacci Retracement Alongside Risk Management
Consistently implement proper risk mitigation when using Fibonacci retracement. Set stop-loss orders just beyond key Fibonacci levels (e.g., below the 61.8% level in an uptrend) to limit potential losses.
Be Patient and Wait for Confirmation
Don’t rush into a trade when the price hits a Fibonacci retracement level; wait for confirmation signals like volume spikes, trend continuation patterns, or other indicators. Monitor how the price behaves around a Fibonacci level — look for price consolidation, reversal patterns, or a volume surge to confirm that the level will hold.
Final Remarks
Fibonacci trading strategy can be a versatile tool, but its real value comes when combined jointly with other technical analysis tools and approaches. By following the practical tips described in the article, traders can use Fibonacci retracement to engage in more deliberate decisions, identify better entry and exit points, and manage risk more effectively.
However, patience and confirmation are key — no single indicator can guarantee success, so always seek confluence with other indicators and price action to improve the odds of a profitable trade.
FAQ
What is Fibonacci retracement in trading?
The Fibonacci coefficient is a technical charting tool used by traders to discern likely support and resistance spikes in an asset’s price based on specific ratios (23.6%, 38.2%, 50%, 61.8%, and 78.6%) derived from the Fibonacci sequence.
Why is the 61.8% level so important?
The 61.8% level, often called the “Golden Ratio,” is significant because it is often considered a strong support or resistance frame. Prices usually react strongly to this level, either bouncing off or reversing direction.
Can Fibonacci retracement be used in all market conditions?
Fibonacci retracement is most effective in trending markets, where prices pull back before resuming the trend. In sideways or choppy markets, retracement levels can be less reliable.
Is Fibonacci retracement a foolproof strategy?
No strategy, reckoning Fibonacci metric, is foolproof. It is most effective with other technical instruments and risk prevention means to confirm signals and minimise losses.


